People like of the idea of buying low and then watching their stock immediately reverse and head higher. That of course, rarely happens and people attempting to catch bottoms often watch their stock go much lower. But let's see if we can turn the odds in our favor with a few tweaks to our framework.
Most significantly, Let's only look at stocks that are in an uptrend. I realize that is not the traditional reversal type trading, but I like to make money so I'm going to bet on proven winners. I'm not going for 10 baggers, but rather low risk trades that can add 3-6% to my equity in a few days.
By way of example, I'm looking looking for something REG. A stock that has taken a rest after a nice run. Its sold off, but the range has become narrower and eventually it goes green. Any buying pressure should spark a decent run. Stops can be tight and positions size large to capture the renewed bullish move.
In Telecharts we can do this with the following formula:
avgc7/avgc65>=1.05 I also add a volume requirement to my scans to weed out stocks that are too thin to trade.
The TI65 formula produces a large number of stocks. I got 845 running it this morning. I have no interest in running through 845 stocks in addition to the other scans I run.
I wanted to find stocks that have pulled back a bit. And since I tend to be impatient, I want to find stocks that are ready to resume their move now.
So I then added another condition to the scan
"c>C1 and C1 < C2 and C2 < c3 and C3 < C4 and C4 <c5"
This provides stocks that are in an established uptrend thorough T165, but have sold off over the past week but have now stabilized and are ready to reverse. On the maiden voyage for this scan I got the following results:
EXAS, LXFT, BIDU, CTSH, AGTC, BBRY, LBTYA, LBTYK, ABAX, BAH, REG, IDT, ESI, TXRH, MAR, SRCL, STE, TREE.
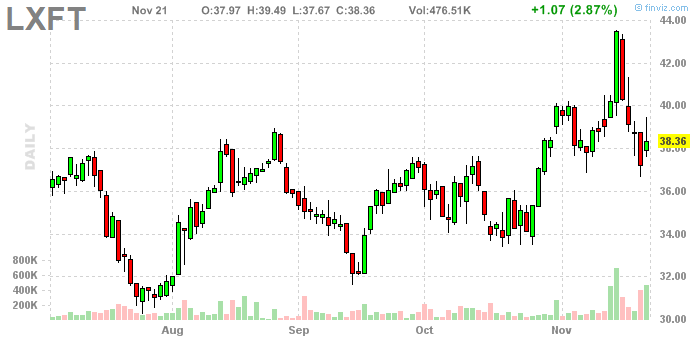
18 stocks. Certainly more manageable than 845. There are several stocks we can weed out right away. such as LXTF. This one gets cut because the selling pressure was not contracting so the last up day, is likely to be a relief rally that will be sold. The bears are still in control:
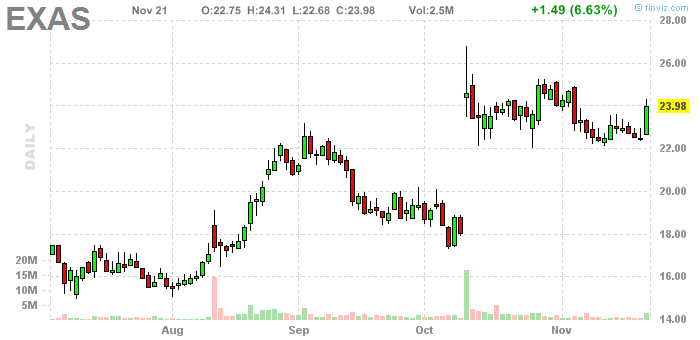
In contrast EXAS, shows that the bears were exhausted and the bulls are back in control.
I'll probably tweak the formula a bit. I'll see what happens if I reduce the number of days use an average so a minor up day would not break the formula etc... But the idea will be the same.