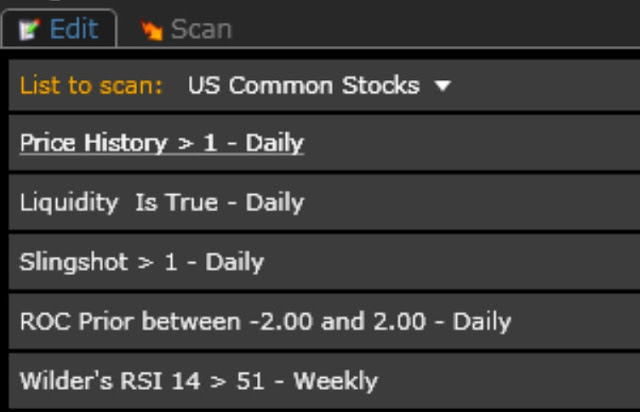
A friend of mine has shown me the value of using Rate of Change to identify compression points in a stock. We talked about combining a Slingshot in the current bar with a ROC of +/- 2 in the preceding bar. He personally also conditions a ROC of >15 in the prior 21 bars but since my coding knowledge is more limited, I went after the concept it in a slightly different way by using a weekly RSI > 51 for now. I'll likely experiment some more, but I like what I see from this scan so far.
As I'm very encouraged by what It has produced, I've decided to share the scan.
Criteria:
Price = personal preference
Liquidity is true = minv3.1 >=55000 -- Personal preference
Slingshot = c > xavgh4 and c1 < xavgh4.1 and c2 < xavgh4.2 and c3 < xavgh4.3
ROC (my work around TC2k Limitations) = ((C1/c6)-1) *100
Wilder RSI > 51 weekly -- Self explanatory, but subject to experimentation.
Results: 11/27/15:


