Saturday, February 14, 2015

Stocks have Personality-- Learn Them and profit

One of the best things about creating a trading journal is that it becomes your very own encyclopedia.  Before I enter a new position I look to see how a particular stock has traded before during a similar move.  If I've traded it before even better.  

One recent example is HPJ.

I know that a number of traders rushed in on the gap move only to see an ugly fade. 


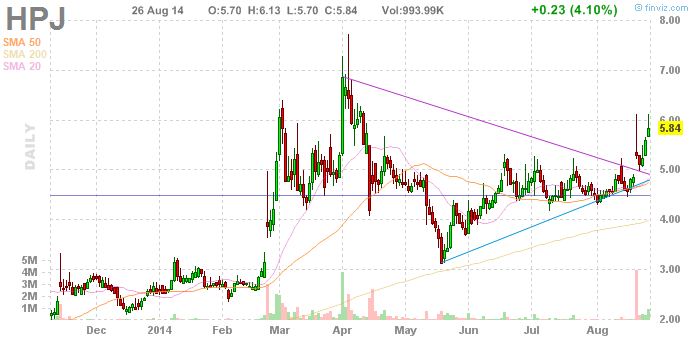
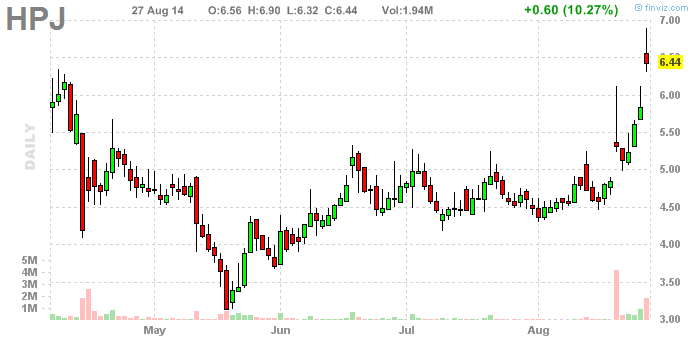
 I waited on the side lines and reviewed my trade journal. Last year I saw a similar high volume gap which faded initially.  


There are a lot of similarities between the two moves.  Last August, I bought HPJ as it fishhooked around the bottom. 


I was rewarded with a 3 day 30% move.  I sold this gap at $6.90 in pre-market.

In any event, last August's move in HPJ was my template for it this time around.  If it rallied off the gap, I planned to buy.  On February 10, HPJ sells all the way down to $5.00 and then reverses. I bought at $5.40


So far ... So good

HPJ is now up to $5.71.   This stocks ability to Fishhook after the 1st day fade tells us there is something more to this move.  Had I rushed in I would have been stopped out and would have missed this move.  But knowing that HPJ has a tendency to fade the first day move and then push higher allowed me to be in this trade. Now I don't expect the 30% move I received last time.  But who knows.

Trend Line Tests.

Trend lines are great to a point.  That point usually occurs after multiple tests of a particular line.  EMES has now running heavy against the 10 Week average.  I've bought puts the last two times it hit the line and then reversed (wait for confirmation).

My current thought is that it is obeying the line too well and running into it too frequently.  By comparison, the uptrend only ran into the 10 Week Average 4 times total before the levy broke.  I will trade this one either way but my present view is that this one is ready to break to the upside. It needs a definitive close above the magic line and probably a successful back test before the bulls will be back in control.

Trade Plan: Sit on hands for now.  If hits on a bullish day and then reverses, buy puts with view of a 1-2 day swing trade.  If it closes above, wait until back test.  If back test does not come let it go. If there is a successful back test buy heavy.


.   

Wednesday, February 11, 2015

Size Matters

I've written a lot of about my entries and exits as they are more fluid and are more fun to write about. My risk management strategy is just as important as the stocks I trade and where I buy or sell.  Indeed, it explains why I trade the set ups I do. I was recently asked about position sizing so I figured it is time for a Risk Management / position sizing post.

In my opinion, the three main ingredients to a successful trading plan are
  1. Entries
  2. Exits
  3. Risk management  
In determining what entry / exit strategies you decide to trade you need to first set the guidelines for risk management. 

The 2% Rule

My first rule is the 2% rule, which comes from Alexander Elder's Step into my Trading Room.  I never  seldom risk more than 2% on a trade.   This does not mean I only put 2% of my funds into a stock, rather it means I may risk up to 2% on that trade.

So on a 100K portfolio that means I can put up to 2,000 at risk on a particular trade.   On most trades I do not go nearly that high.  A trade that I will risk 2% is saved for very high conviction trades.

Interplay between Risk and Position Sizing 

Most of the trades in my trade journal are entered following a tight range.  The reason for that is that allows bigger size on a  trade because I can place my stop tighter without placing it into "noise"

Suppose two stocks are set up for a break out at 10.00.

Stock A, has been range bound between 9-10 and Stock B. has been range bound between 9.50 and 10.0.  On Stock A, I could place a stop a 9.00 and buy $2,000 shares.   On Stock B I could  be able to buy 4000 shares and place a stop at 9.50.     

Assuming both stocks rallied to 11.00 my profit would be double in Stock B, 4% of my portfolio than in Stock A, which would be up only 2%.

Here is a position size calculator, which you can use to put in your parameters before entering a trade.

Tight Trading Ranges = increased position sizing

Much of my trading strategy and stock scanning is to find stocks with tight trading ranges.  

For example, this trade from last year turned out to be one of my best momo burst trades. I entered on October 27 (big white bar at right of screen) as the trading range to the down side was very tight. 

Entry 
25.93 as RWLK rallied off 25 past the prior days contracted range.  
I was able to risk .25 of my portfolio on this trade placing a stop at $25.50

Exit: I sold  the next day (last day on this chart) at 31.73 (I knew this stock had a history of fading so I sold the open) This turned out to be a  6.6% gain for my portfolio in a day.


Those are the types of setups that offer asymmetrical risk profiles.  I try to find the best and then trade them with the amount of size warranted.  

Monday, February 9, 2015

Dan Zanger interview

Dan Zanger is the Guinness book of world Record Holder for the best stock performance.

In this interview he shares his techniques for trading. 


Take Aways:

  • Focus on the Best 4 CANSLIM stocks
  • Earnings of 50 - 100% year over year 
  • Look for Massive Volume 
  • Stocks Make 2 -3 moves a year.  The rest of the time its a Chop Fest
  • Focus on high priced stocks
  • Use Margin.

Sunday, February 8, 2015

Putting the pieces together to capture a $53 in under 2 Months.

Let's see if we can dissect some power moves so that we may capture these in the future. 

Netflix January 14. 

Netflix makes an earnings gap and then tests the gap.  
It then produces a surges which allows a Fishhook entry--High volume move, shallow pull back, thrust past surge close.

 If a stock is going to surge it is going to obey a shorter MA and NFLX did so beautifully.  
This trade would have produced gains over $53 in under 2 months.   Not bad. 


Ingredients, great earnings, high volume,  Fishhook entry , trailing moving average. 


Saturday, February 7, 2015

Big Gain Hunting. Finding The Highest Momentum Stocks

I'm interested in finding stocks that can make power moves.  I've created a video to explain the process.


The "MDT"  formula for TC2000 is "c/avgc126"

Tuesday, February 3, 2015

Overcoming Bias --- Use the Force!


Many times as traders we  have biases about certain stocks. Certain sectors have bottomed are oversold, are a solid investment etc.  In other words, we hindered by what we think a certain stock should do.  Too often this cacophonay of rumors, message boards, other traders' opinions and our  own need to be right drowns out what the market is telling us.


I was recently inspired by a story told by a successful member in a trader group I belong.  This trader reported that he had a friend who was an accomplished trader and money manager that had previously put up several digit returns managing a multi-million dollar account but was now  struggling.  The struggling trader was now down double digits in January and asked for advice.  The successful trader looked at the stocks the struggling traders had been trading and did something very creative.  He removed the names from the stock charts and asked the struggling trader friend what trade he would make.  

After going through the exercise for over 6 hours. They learned that struggling trader would have had a 90% success rate had he followed his system.  But instead of following his rules, the struggling trader was stuck trying to pick bottoms and making other knee jerk reaction type stocks.

This story inspired me.  Why not just remove the names and tickers from my charts and then do my scans. After all, Luke learned to use the fore with a blindfold.


So here's my Force Chart:

Stock 1

I ran a normal scan and then scrolled through charts until I came to one of interest.

What do we know about this stock?

It recently broke out in a very big way with huge volume.  From that we know that there was a fundamental change to this company.

Was it earnings? An FDA approval?  I don't know and that's the beauty of the approach.   Is there a trade to be made here?  Not under my rules  This is $8.00 over its breakout point.   Chasing a story would likely cause a loss.

What about this one?
Stock 2

This stock also saw a big gap on high volume.  This has the look of being earnings related but the prior day had a big range expansion day so, perhaps not.

 After the initial burst this stock has now settled in  I don't see this as being able to make a burst move that would last 3 days and it would be difficult to place a trade at this level.  To trade this stock, I would want to buy support by waiting until a test of 35 and buying that test.  At the current levels I don't see a trade here.

That analysis was easy to do.  But what if I had just read a detailed SeekingAlpha article by someone who said Stock 2 was his top pick and was surely headed for a double and citing some sound reasons.  we might be tempted to chase if the stock starts moving.

But to avoid that temptation, Use the Force.