Wednesday, April 29, 2015

Why I went to Cash


I went to all cash on Monday morning selling my positions one after another like dominoes going down.  The reason I did was that I got a big warning on the market monitor. Over 20 Stocks were up over 50% on April 24. What the 20 > 50%  signals is that there is over exuberance in the market the bullish side. That's the equivalent of red lining your car.  You could push it more... but its not going to end well. 


The Beer Goggle Effect

After a big run, you will start to see the quality of setups diminish.  Nonetheless,  many traders start getting beer goggles and start thinking that every setup looks good.  Next thing they know it they wake up the next to something hairy and it hurts when they pee.    


In my opinion, the market needs to hit the reset button here and clear the junk out so that the good risk / reward trades are allowed to present themselves.

Remember, cash is a position and sometimes it is a very good position.

Cheers!

Saturday, April 18, 2015

Review of www.Stockbee.biz

I thought I would do a post about the stock trading sites I subscribe to, why I subscribe to them, and how I am trading the setups utilized by those sites.

The trading community that I have been a a member of the longest is a momentum trading group called

Stock Bee.


Stock Bee is run by Pradeep Bonde (a/k/a Easy Guru).   I followed his  free blog for over a year before taking the plunge and becoming a member. I have been a member for about 8 months now. I believe its about $300 for the year. It is an excellent value for the expense.

Subscribers are afforded access to a vibrant community with some excellent traders.  You will find that there a number of different strategies that are traded and members are very helpful showing the ropes to new traders and sharing the nuances of their setups and systems to each other.

You will not find stock picks here.  I like to tell my friends that Stock Bee trades setups not stocks.  By that I mean, there is a hyper focus on the quality of  individual setups but there is little to no discussion of the fundamentals for those stocks.

With that caveat, the bread and butter setups taught by Stock Bee is the the "Momo Burst".  The Momo Burst was a significant part of my trading strategy and a big reason why I made 47% last year.

A momo burst looks for:

(1) stocks in an uptrend (preferably the beginning of a new trend)
(2) a period of range contraction
(3) a range expansion that is bought
(4) a 3-5 day move

Risk Mangement:

(1) stops generally placed at the low of the day.  Stop hunting algos? We don't care a good burst should never look back.

(2).  EG's trade risk is usually around .25-.5 per trade, But I usually go 5 to .75 of my equity on a trade.

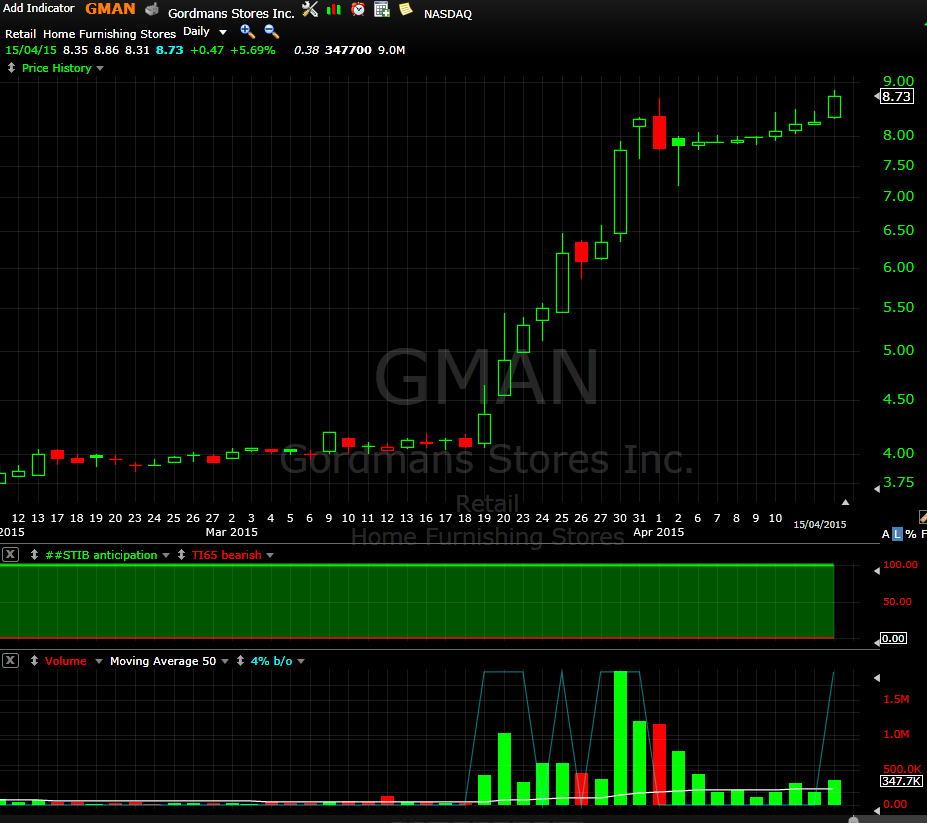
Stock's Free Blog highlighted  GMAN as  good setup and it is a perfect example of what an ideal momo Burst would look like.

It had a very powerful move and has then entered range contraction and on the right edge expanded.


PROS:
This set up appears 1000s of times a year.
Many opportunities to practice the trade
A postive expectancy.

CONS:
Are you mentally prepared to make 100s of losing trades a year? 10 loses in row?
Can be mentally exhausting

My Experience
 I had a 57% win rate in 2015 and an avg win / loss 1.03 / 1.00.  So not great but that small edge builds up over time.  Even so, I can attribute  a lot of my gains to just a few trades. For example, I had a trade in RWLK  I risked . 25% of my account and made 6.6% gain on my account on just a 1 day Burst.

My chief disappointment with the system is that there are a ton of failed range expansions and also there were a number of burst I sold for 5-8% gain winners on stocks that would run 100-200% from that point.

I want the monster moves!

The "Episoidic Pivot"  The EP trade is supposed to go after the monster move.  The Theory is that a stock goes through an major game changing event such as fantastic earnings after being neglected for years.  Stock Bee's summary is here.

On an EP you want to buy as soon as it happens even pre-market and your looking for 50% + gains moves. You want to see massive volume and a gain changing news:


Pros:
The gains can be enormous.  Jesse Stine used this type of strategy to take his account from 46K to over 6 Million in under 3 years.

Cons:
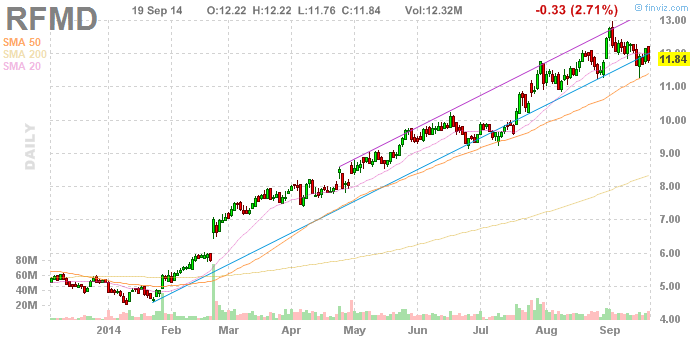
The setup appears infrequently.  The only EP I've had were NOK when it sold it's phone division to MSFT and RFM when it merged with TQNT.


My Experience:

I've been awful with this setup.   The true EP appears infrequently and there are many false positives. If you are buying pre-market gaps on non-EP's you usually get stuffed.  A lot of times great earnings can be subjective, and how do you really know whether a bio tech's news on a phase 1 or 2 trial really has significance?

I've also noticed that there are many stocks that make fantastic 100% +moves without ever having a true "EP"

It is these stocks that I've been studying and trying to figure out how do I get in them. Perhaps there's a way to quantify an EP type stock without having to read the tea leaves in press releases?


Update 2018:

My favorite part of stockbee is the forum-- which I affectionately call the beehive.  There are many different styles of traders in the room.  Although I've since moved to a longer term focus since first joining, there are other traders in the group that use my approach.  Others are 100% mechanical and there are a few day traders.

The people I've met in the group include people that that have placed in trading competition and are now doing national speaking engagement.  So its an amazing opportunity to learn from some great traders. I have benefited immensely from the free flow of ideas.





Wednesday, April 8, 2015

The Struggle

I hit this one of on a pull back to 13.90   On a weekly I can see there is a Week 1 breakout and this thing is going higher. Easy right.  Not so much.

Yet I sold it yesterday after watching this painful hour, sure it was only a .70 drop, but when you have profits and your seeing them rapidly evaporate you start thinking where's the bottom? Am I going to give it all back.    So I pull the trigger and take a 10% gain.

 Of course the next day, ADXS rockets for 17%, which is why I write this post. After all, if it had continued to drop, I would just think I'm smart.  Oh well, something to work on.

For whatever reason, It is easier for me to sit through a pull back and keep to the plan if I don't have big gains in a stock.   On those types of trades I know where my stop is going to be when I take it. If it goes against me fine, that's expected but when I get up big the exit is not so clear.


Sunday, April 5, 2015

Chasing Power


Eric Muathe's  You Tube Videos are a must see for the traders looking for big moves.

Friday, March 20, 2015

Fishhook Update

After studying my Fishhook trades over the past year. I've made a few tweaks.


1-2-3 Go!

I've learned that buying before a 2 day rest is dangerous.  It is chasing a stock that have already run.  We want safer entries into extreme momentum stocks.   On REPH, I executed the 1-2-3- go rule perfectly this past week as it made a 40% 2 day burst.


UPDATE:
In the previous chart, I said this was ready to go..  3 days later it hit $9.93 for a 15% move.

This was a lesson I've learned the hard way.

CAPN.  I could see the Fishhook forming but I jumped it:


Had I waited for the 1, 2, 3, go, I would have gotten the buy signal the next day and a 35% 2 day move:


If a breakout before day 3 it is  not Fishhook.  Buying a day 1 or day 2 is buying a continuation pop on an extended stock:

IPOS:


Aftermath:
Although the initial gap faded, the next day--the  1,2,3 go day-- pushed higher.  Admittedly this would be a more difficult breakout to buy  than a breakout from linear action such as reph, but it nonetheless could be bought with a stop at the gap.

I personally think that it would be easier to buy off the next breakout as FRSH now has nice tight consolidation.  A range expansion breakout next over $18.30 would present an ideal entry:


Risk Management:  Fishhooks on a daily timeframe are short term trades.  They should last 2-4 and hold the breakout.

Hold the Breakout --- preserve capital.
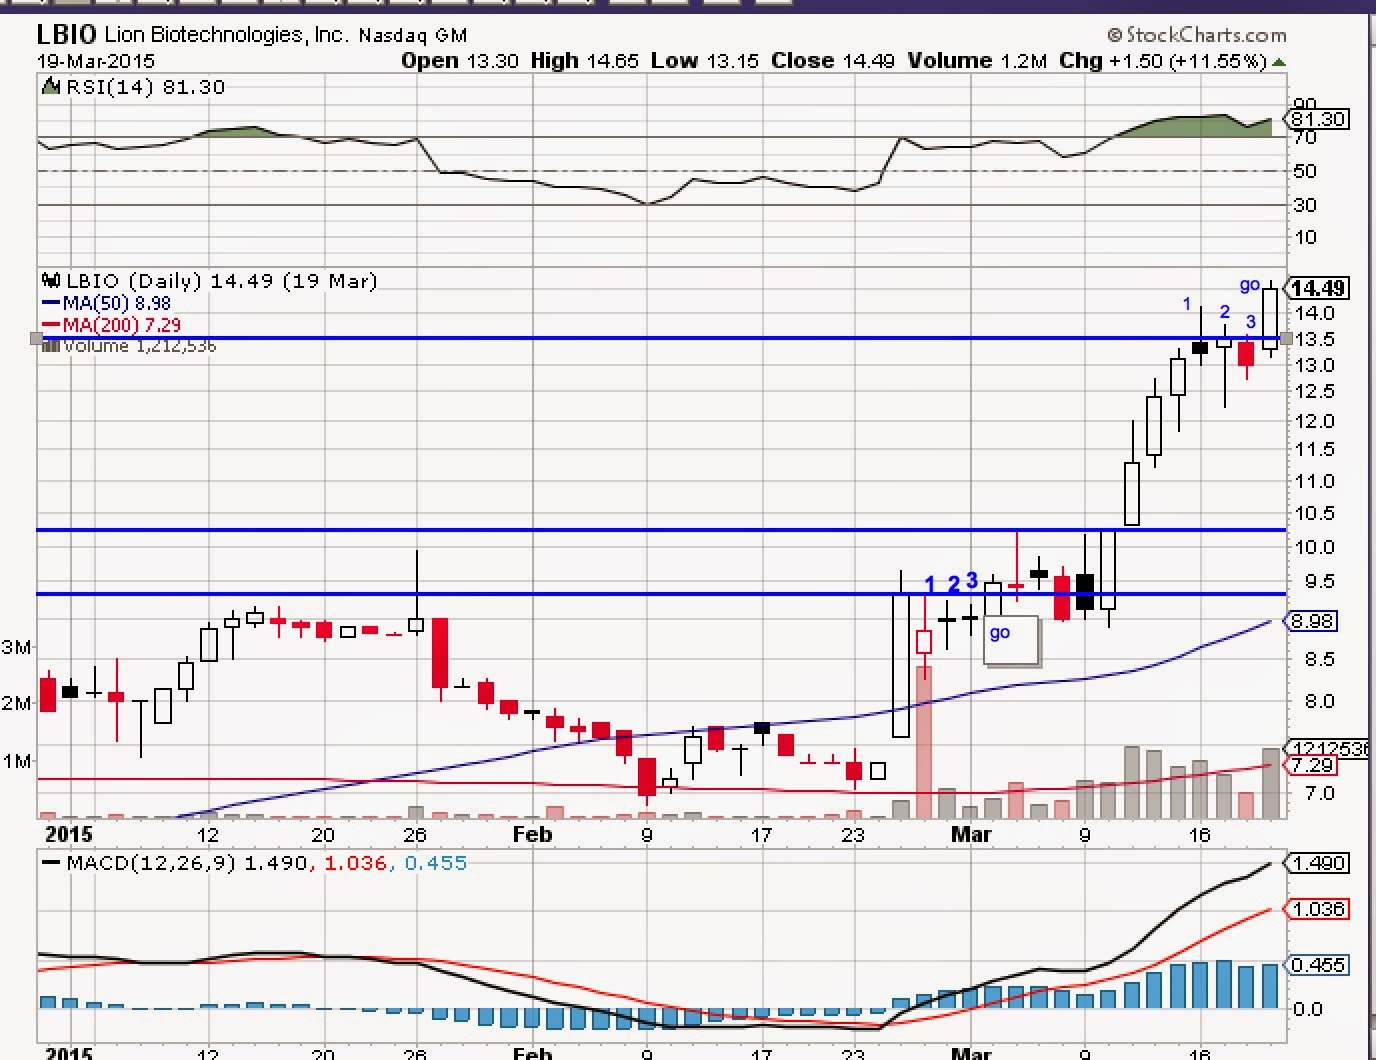
A good move should hold the breakout at a minimum.  I got a Fishhook signal in LBIO yesterday.  I took it, buying the breakout at 13.80:


Be wary of Gaps:

Most investors talk about gap ups as if it is a positive.  I hate them.  As gaps often put in a ceiling.  Today,  LBIO Gapped to $15.  That sounded alarm bells for me.  Often the Gap signals a reversal in the works. If a fishhook gaps... do not let it go negative.  On this one I raised my stop to $14.35.  So I made $.55 on this failed fishhook.  I should have raised to yesterday's close but still not a bad result for a failed breakout.


Safety Nets:
I've had a number of Fishhooks do remarkably well and others make me look foolish.  I've since studied why some work and other don't.  I've since determined that RSI works very well as a filter.

Here's one that failed.  I bought Day 2,

Buying early was  my first mistake but the second mistake was that this stock had a very poor relative strength on a weekly:

Another Fishhook fail:  Note that the Weekly RSI was not over 70.

But a fishhook Win:

The weekly RSI  and MCAD at the time were the highest for the year.


TIME FRAME

Its important to know what time frame the breakout is occurring.  On REPH the daily is setup for a fishhook as described above, but on the weekly its extended. As a result, taking a fishhook on a daily, requires the exit to be taken on a daily frame.


A stock that is setup  for a fishhook on a weekly may be held for a longer period when the breakout occurs. PFNX looks like it is setup three narrow range days.  Any breakout above 15 can be bought:
  PFNX. 


Aftermath:  Boom! run to $19.


Conclusion:
  • A fishhook Must rest at least 2 days.  Remember 1, 2, 3, GO!
  • A good fishhook holds the breakout.  Take the breakout preserve capital by moving stops to breaking point.
  • continuation gaps are yellow flags.  Any Gap requires moving stop to prior day close.
  • Use the RSI and MACD for the time frame above what you are trading. If these are not setting new highs. DO NOT TAKE THE TRADE!


Sunday, March 15, 2015

Power Scan.

Powerful stocks have a multi-year breakout on RSI.  Here's the Scan I've been using.

This Scan provides a list of the stocks making a 2 1/2 year high on the RSI.

Friday, March 13, 2015

Average True Range / Momentum Burst Indicator

I recently received a question about my ATR Momentum Burst indicator I include on many of my charts.  (3rd window).

The Bullish / Bearish Range should be well-known to many traders as it is the 4% spike.   I have a volume requirement on mine, so the Bullish burst would be:

" C >= 1.04 * C1 and V >= 100000 AND V > V1"


 It's my belief that momentum burst is more significant if it comes during a quiet period. To make that determination I plotted an ATR within that window:


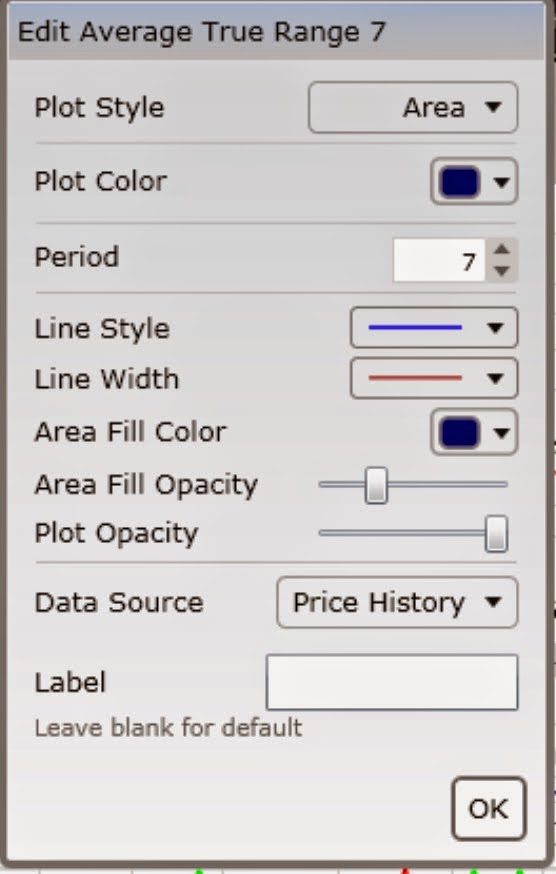
Select "Average True Range"and have it scaled by itself.  Once you select the ATR it may be edited for the number of periods. I believe that the default setting is Average True Range 14. I used 7 -- which is a week and 1/2 of trading days-- but feel free to play with it depending on your needs.

I picked the area plot style with a fill, because I want to see the Momentum burst pop out of that range. 

Finally, keep in mind that this is not a primary  indicator.  The setup trumps everything else.  Second for me is volume.  If those conditions are met, this indicator tells me the significance I should attach to the move.