I've had a lot of questions about how I find big gain stocks and trade them with the Fishhook setup. This post is a follow up on my initial description of this set up

The Fishhook Setup that I described has been performing extremely well. It has performed much better than the range expansion breakout that I also trade--which has had limited follow through the past few weeks.
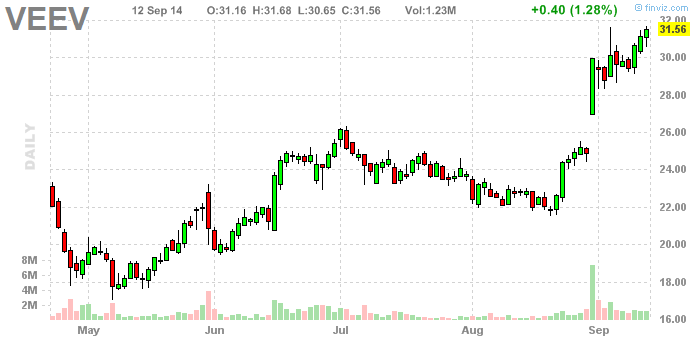
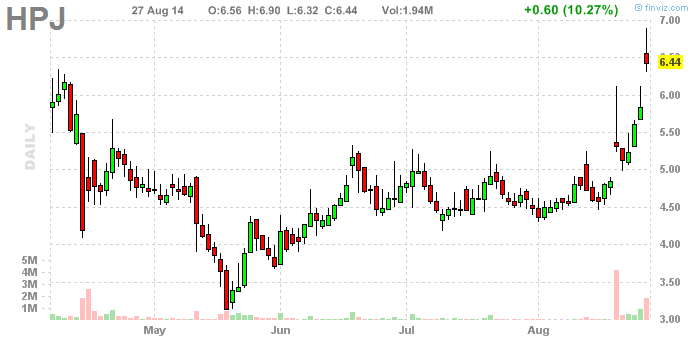
In contrast to the range expansion set up, the Fishhook has hooked a 50% 1 day gain in OTIV, a 33+ 3 day gain in HPJ, and some worthy smaller gains in CDXS 26%. Losses? sure, VEEV produced a small loss. But as I noted in my exit for VEEV, I ended the trade prematurely. Had I followed the plan kept my original stop I would have gains:
- What is the purpose of the Fishhook Set?
The Fishhook is best used on stocks that have just made a big high volume move. These are the stocks that either gap up like VEEV or make a high percentage move in one day. At that time, many traders become afraid to buy out of fear the gap will fade or the stock will pop and drop. Many traders get stopped out on the first pull back and are sitting on losses despite a powerful move in the stock. Often these stocks still have a lot of power left in them and can make huge moves.
The first move looks like the tip of a fishhook with very high volume, the retrace curves around and goes up to the line. My buy in HPJ was at 5.26 was here as it started coming around. This was a great low risk entry as I could keep the stop at the retrace low (5.00).
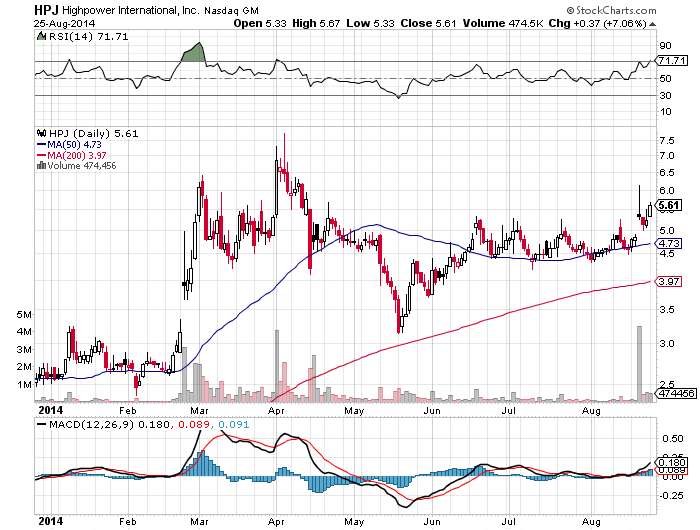
The power that lead to the high volume move resumed. I sold as high as $6.90 not bad for 3 days.
2. How do I find these types of setups ?
Although I have tc2000, I use finviz for this particular scan. Finviz will also provide the news, insider buying/selling, financials etc.. that makes it quicker to perform the scanning.
Step 1: Look at the "unusual volume" list. I filter out stocks that were down, are below $1 and stocks over 40 as they are not likely to produce quick moves. My specific scan is here. On most days this will return 70-85 stocks. Most of these are not great candidates
Step 2: Cut the list. I don't want ETFs or stocks that may have gotten bought out as the likelihood for a future move is limited. In addition, I eliminate stocks that are moving on the wrong kind of news. What do I mean by that?
Consider TNET:
"The business service company priced the 12 million shares of common stock at $25.50 a share. The underwriters of the offering have a 30-day option to buy an additional 1.8 million shares of common stock from the selling shareholders."In my opinion, a secondary offering is not likely to produce a big continued pop. I would also weed out a chart that looked like this:
These types of stocks are too erratic to trade and when "unusually high volume" is just 40K shares you are asking to get stuck in the stock.
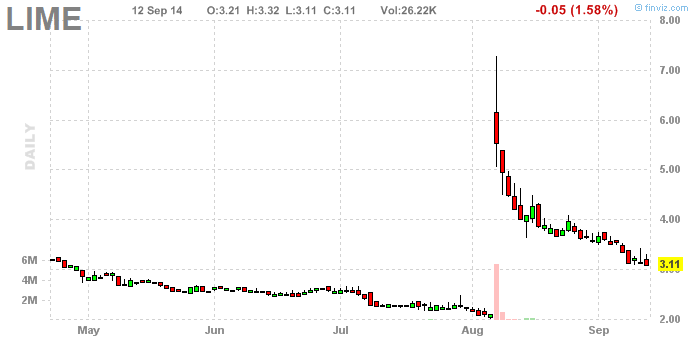
Step 3: Next put the good candidates on a watch list. I keep a IB watch list just for this set up. The point of the Fishhook is to let them retrace will they pop and drop such as LIME?
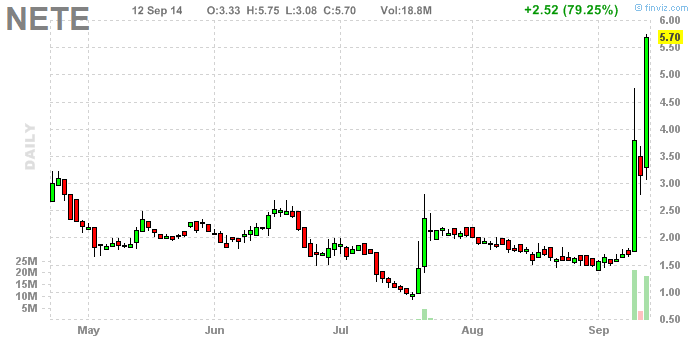
Or continue their move with renewed force like NETE?
3. When to Sell?
This is the question that has plagued me the most as a trader. I'll be the first to tell everyone that I frequently sell stocks too early. I've gotten good at taking loses quickly, which has accounted for my lack of severe drawdown this year but i've also missed out on some big gains by rushing to trade or prematurely ending it. I have to acknowledge that I am selling a lot of positions early due to concerns of the overall market. If the market sells off and my profits start to fade, I'm out.
What has worked for my psychological makeup is to take a big position and sell it off in pieces as a trade works. When I get a big pop in a stock, I was always sell off a good sized portion of my holdings if not the entire position.
For example, HPJ kept going pre-market I was more than pleased with the size of the gain so I sold same for OTIV. With both stocks I sold off a bit on the initial gap until it got to the point where I had crazy gains for the limited time I held so I sold the whole position out.
Jesse Stine's book says that with Superstocks sell when they get extended beyond the 10 Week moving Average and definitely when that average breaks. But for me, I trade mostly on daily charts and my sell strategy remains a work in progress. If anyone has suggestions for quantifying a sell strategy please leave a comment.
Nice post, thanks for sharing
ReplyDeleteDo you have a minimum volume criteria in your Finviz scan. I only see a Signal of Unusual Volume and Price over $1.
ReplyDeleteThanks for your infomative post.
I don't have a volume criteria. The reason being is that Jesse Stine and StockBee explained that some of their best trades came from stocks like BOOM that had averaged 30K shares before being discovered.
DeleteIt doesn't take that long to go through the charts to see if there is anything significant that could cause an extended move.