Eric Muathe. Muathe.com
One of the members on Stockbee pointed me to Eric Muathe's "
Ultimate Breakout" This was an Eureka Moment for me as it looks a lot like the method Stewart applies and is stated in a manner that is easy to understand.
Most people look at RSI as being an "over bought / oversold" indicator" over bought being a sell signal and over bought being a potential buy signal on cross overs. Muathe does not. He wants RSI power but there's a catch. He wants the RSI power to be on a monthly time frame.
Muathe's website subscription is inexpensive ($250 for the year) but it could use some updating and a message board would be great. That said, his analysis is decent and his videos are lengthy.
Muathe's criteria using a monthly chart are:
1. RSI over 69.10 (most people use 70 on the RSI but Muathe uses 69.10 as it is a fibonacci number)
2. An RSI 3 year high?
3. A price breakout with RSI over 69.10
Muathe's risk management is to apply a stop 5-8% from the buy.
Fishhooks & Muathe's Rest Periods:
Last year I worked out a setup I call the fishhook, which is designed to catch the power moves off a significant event. It was aimed at avoiding the "pop and drop" I figured that If a stock popped and was able to fight off the attempt by the bears to drop it and made a new high it could go a lot higher. My first description of the setup is
here but I've made a few tweaks.
After subscribing to Muathe I realized that he also had a rule for trading those types of set ups. Muathe's technique for chasing extended stocks is brilliant and was eye opening for me.
- On a daily chart a stock must have 2 days of rest
- On a weekly Breakout 2 weeks of rest
- On a monthly 1 week of rest.
My Experience.
My experience using the Muathe's techniques has been limited as I've only been using it for a month. I feel that it works well with the StockBee's momo burst setup.
My process for combining the StockBee Momo Burst With Muathe Ultimate Breakout:
- Start with the Scan for 3 year RSI highs (Muathe uses 34 bars as that is the fibonacci number). I usually get between 150-350 stocks.
- I then sort by highest MDT (on the daily) This tells me which stocks are currently enjoying the highest momentum AND a 3-year RSI high.
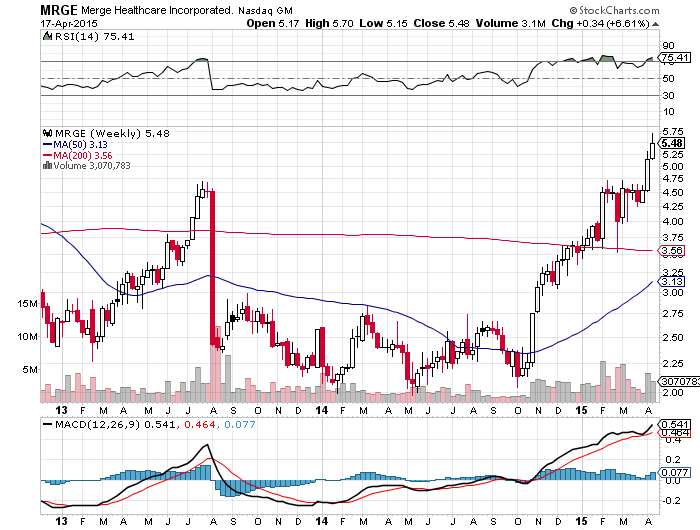
- Look at charts for weekly breakouts and set alerts. It's a weekly B/o if has had at least 2 weeks of rest.
- Use the StockBee Momo Burst setup for an entry on a daily chart. I will not take a weekly breakout if the stock is extended on a daily chart. Although my sample size is still limited, I believe that the best trades result when a tight daily range triggers both a momo burst and a week 1 breakout.
- Stock's Risk management works better for me as I feel the %5-8% rule is too nondescript. On a cheap stock I can have a 20% stop and still only risk .25 of my account depending on position sizing. That I understand.
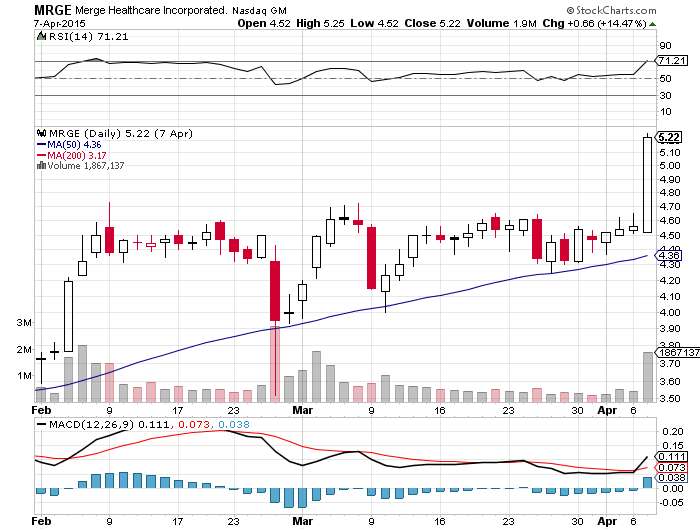
Example Trade:
I bought MRGE at 4.80 On week 2, I have over a 15% gain:
On the daily, Momo Burst on breakout day: Tight range and expansion.
Update:
I no longer found the service to be valuable. The scans are interesting in that a high RSI on a weekly will identify trending stocks. However, Muathe's "picks" and trade management were nothing special.