Showing posts with label Slingshot. Show all posts

Wednesday, May 10, 2017

Setups

Here's a couple examples of setups.  First, the slingshot.


Then the fishhook, great for earnings plays.


The fishhook can be used with a 1/2 or hour slingshot as a trigger for an earlier entry.  The shorter the timeframe the more false positives there will be.


Friday, November 27, 2015

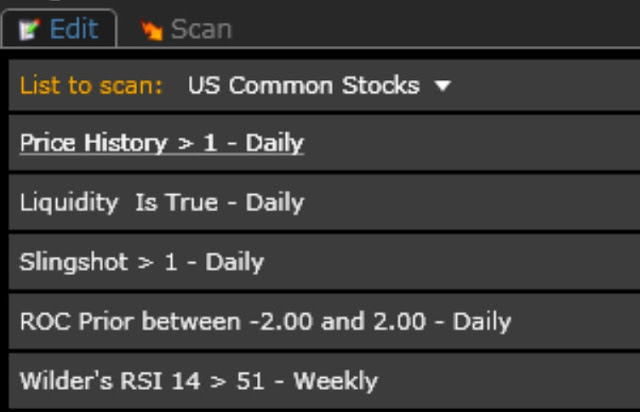
New Slingshot Anticipation Scan

A friend of mine has shown me the value of using Rate of Change to identify compression points in a stock.  We talked about combining a Slingshot in the current bar with a ROC of +/- 2 in the preceding bar.  He personally also conditions a ROC of >15 in the prior 21 bars but since my coding knowledge is more limited, I went after the concept it in a slightly different way by using  a weekly RSI > 51 for now.  I'll likely experiment some more, but I like what I see from this scan so far.

As I'm very encouraged by what It has produced, I've decided to share the scan.

Criteria:


Price = personal preference
Liquidity is true = minv3.1 >=55000   -- Personal preference
Slingshot =  c > xavgh4 and c1 < xavgh4.1 and c2 < xavgh4.2 and c3 < xavgh4.3
ROC (my work around TC2k Limitations) = ((C1/c6)-1) *100
Wilder RSI > 51 weekly -- Self explanatory, but subject to experimentation. 

Results: 11/27/15:


Wednesday, October 21, 2015

Thrust--

I'm working on refining the trigger for my slingshot setup.  If I combine the setup with my "Thurst" indicator:  -- a 4EMA of the HIGHS -- --- This setup is to target a reversal of a shallow pull back.  I would consider any new thrust as anything more that 4 pull back bars.

NOTE: I do not keep my charts this messy ... this is for illustrative purposes only.

I'm encouraged with what I see:


Monday, August 17, 2015

Introducing the Slingshot

Over the weekend, I spent some productive time working out a new power setup with a couple of my
trader friends.  We are fondly calling this setup the  "Slingshot."

This setup takes a stock that recently had a power move and has stretched back under the EMA 4 --- but not too far-- The EMA 9 should be the limit.  When it gets pulled back through the green side of the EMA 4 it has accumulated power and is ready to go.

The great thing about this setup is that it gets you in power stocks sooner, with tighter stops then waiting for a breakout.


Here's a perfect example: EFOI gets stretched through the 4 to the 9.  I picked it up at 13.24 as it came back through.


How did it do?  Only about 40% in the next 2 days.

TREE:

Aftermath: +20pt move and counting

SPNS:

EVHC:


Under the surface:

I'm a big fan of hourly charts. The weekly gives you the trend. The daily gives you the landscape, but it is the hourly that gives you the entry.

That said, I can get jumpy and I did this morning in ALJ.  It retook the 4 and broke the hourly downtrend channel in the first inning of today.  So I took a position. It was stuffed and I took a stop.

I'd be far better off waiting for 2 hour bars for confirmation.


Done correctly:


Follow through:

After the Slingshot shoots, the EMA 4 should never be breached on a close.  Consider it the trailing stop on the position.  Of course, take profits on the way up.

After I presented, this post I had a follow up question as to how this differs from the Fishhook.  There are two significant differences.

First, is the timing.  The Fishhook was designed for Week 1 moves.   Power move rest two days and boom!


The second is the trigger point.  The fishhook buys on confirmation when the first day high is taken out.  The Slingshot buys lower when the 4EMA is reclaimed.  (but again consult the shorter timeframe such as the hourly-- we want to see a break of the downtrend channel)