Showing posts with label Study. Show all posts

Monday, January 29, 2018

You Always Sell Too Soon?

One of the most common complaints I hear from traders is that "I can't hold my winners long enough."  I've been there. Here's an amazing 7 point gain that doesn't look so amazing in retrospect:


It's taken me a long time to slay my demon that made me sell stocks for small profits.  Let's face it, selling makes us feel good, then move on to the next and repeat.   The problem is these small gains don't do a whole lot for us.  In any given year, how many of your trades actually impacted your bottom line.  For me it wasn't that many.  Most of my small gains were canceled out by small losses.  It was the few large gains that made my year.  But I saw I wasn't maximizing them.  I was taking partial profits and worse, I was missing huge trends when I had nailed the entry perfectly.

So after much analysis, I realized that I needed to maximize my homeruns.  To paraphrase Soros, its not how often you are wrong or right, its how much you make when your right.  To that end, I need to adjust my approach to allow me to maximize my profits when I got it right.

 It turns out the solution was pretty easy.

Here's the cure.

Stop caring.  Stop caring about making a 8 to  20% gains.   That's noise.  If you are in a winning stock that will make  100% gain or more you have to be willing to let the stock come all the way in.

As Ray Dalio discusses in his "Principles," to be successful, you can't overweight the first order consequences at the expense of the expense of the second and third order consequences.   Yet so often I see people bragging on twitter and stock twits about nailing a 20% gain.   "Congrats to my followers" they say.  -- By all means follow them to mediocrity.

If 20% is good enough to take profits, they will NEVER hit the 100% or more winner that has life changing potential. You can't have it both ways.

When it to Sell Your Stock:

  1. Stop loss -  The max amount I'm willing to risk when taking a position on.  
  2. Break Event / ITM Stop:  After a stock moves in my favor, I usually move my stop to break even to slightly in the money.   The logic being that If I'm stopped out at this point, it hasn't cost me anything and if the stock re-sets I can take another shot at it without having cut into my equity position. 
  3. Failure to obtain an earnings cushion:  Risk management first.  If you don't have 10-20% gains (depending on the stock) you can't take it into earnings.  
  4. Market conditions: If leading stocks are getting distributed, it doesn't matter what your stock looks like, get out of the pool.  As Jesse Livermore wrote:

"An old broker once said to me: ‘If I am walking along a railroad track and I see a train coming toward me at sixty miles an hour, do I keep on walking on the ties? Friend, I sidestep. And I do not even pat myself on the back for being so wise and prudent.’"

  1. Psychological levels:  buying tends to slow after runs at the major psychological price levels, 50, 100, 150, 200 etc...  If you have gains, this can be a great place to sell into strength.
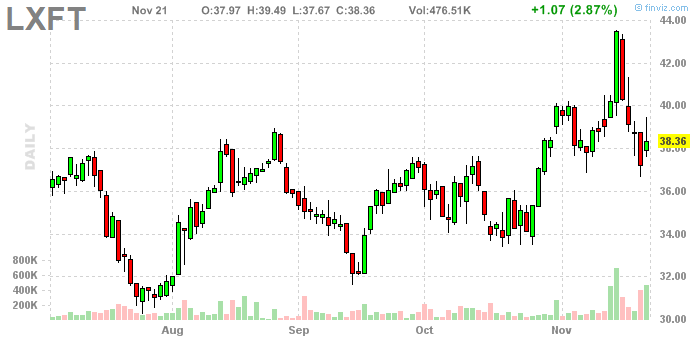
  2. Parabolic Character Change -- when the trend of a stock suddenly accelerates it is often at the end portion of its run.  Sell into the strength:

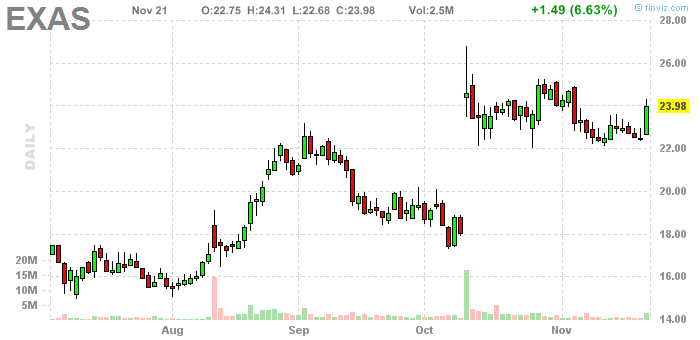
Abnormal distribution:  If selling hits your stock that is high volume and is out of character get out- ask questions later.


Friday, March 13, 2015

Average True Range / Momentum Burst Indicator

I recently received a question about my ATR Momentum Burst indicator I include on many of my charts.  (3rd window).

The Bullish / Bearish Range should be well-known to many traders as it is the 4% spike.   I have a volume requirement on mine, so the Bullish burst would be:

" C >= 1.04 * C1 and V >= 100000 AND V > V1"


 It's my belief that momentum burst is more significant if it comes during a quiet period. To make that determination I plotted an ATR within that window:


Select "Average True Range"and have it scaled by itself.  Once you select the ATR it may be edited for the number of periods. I believe that the default setting is Average True Range 14. I used 7 -- which is a week and 1/2 of trading days-- but feel free to play with it depending on your needs.

I picked the area plot style with a fill, because I want to see the Momentum burst pop out of that range. 

Finally, keep in mind that this is not a primary  indicator.  The setup trumps everything else.  Second for me is volume.  If those conditions are met, this indicator tells me the significance I should attach to the move. 

Saturday, December 13, 2014

Market Monitor

One of the tools that is used to get a sense of the market conditions is StockBee's  Market Monitor.  The market monitor seeks to ascertain what phase the market is in by looking at a number of indicators to gauge the health of the market.

Primary indicators:
  • Stocks up 4%
    • Up to 300 normal buying pressure
    • 300-500 high buying pressure
    • 500-1000 very high  (beginning of a bullish turn from a bearish phase)
    • 1000 extreme buying pressure 
    • 300 plus days are common in bear markets as short squeezes
Very High buying pressure
End of year 877 followed by 952 4% moves: over a 9% move on the Russell in 3 days. 

Extreme Buying
1000 extreme buying pressure -- most likely to come during a bear market  -- November 13, 2008    2242!  over an 8.5% day on the russell   

But this move did not stick as it made new lows -- see chart 1. It reversed the next day. 
DOWN:
up to 300 Normal selling pressure
300-500 high selling pressure
500 to 1000 very high selling
1000 plus extreme selling

Its been suggested that bear market rallies after a 1000 -- so a down day of that level would be bullish But is it? Consider 2010 there were a number of 1000 stock down days

5 day Breadth Ratio 
# of stocks up > 4% in last 5 days/#of stocks down > 4% in last 5 days

10- day Breadth Ratio
# of stocks up > 4% in last 10 days/#of stocks down > 4% in last 10 days
When market is in bearish phase first time ratio is  2 plus signals start of a bull move. 
Ratio below .50 signals start of a bearish move after a bull move has been in progress.

 2 plus readings are good for swing trading on long side.
.5 or less readings are good for swing trading on short side.

Number of Stocks Up 25% in a quarter
Market is in bullish phase while the # of stocks up>25% in a quarter is greater than # of stocks down>25% in a quarter.When this number goes below 200 it is extremely bullish. It indicates extreme bearishness. Rallies which start from readings below 200 are extremely powerful. 
EOD readings of below 200 are rare, most of the time 200 readings are reached intra day for few hours or minutes and market rebounds.

So when EOD readings drop to below 500 be on watch out for a reversal of bearish trend.

Number of Stocks down 25% in a quarter

Market is in bullish phase while the # of stocks up>25% in a quarter is greater than # of stocks down>25% in a quarter.
When this number goes below 200 it is bearish. It indicates extreme bullishness.
Readings below 200 are rare and happen only intra day. 
So watch for EOD readings of below 400.
Unlike end of bear market in bull market, markets do not turn immediately after such high readings.

There is a delay of 2 to 6 weeks before real selling might start and a top is formed.

50% in a month
This indicator tells you intermediate term extreme bullish phases and likely pullback/correction points
Readings above 20 are bearish 
They indicate high bullishness and tend to lead to correction.
Market resumes its bullish move once such high readings drop below 10.
Readings of below 3 are bullish.

I've noticed that fishhooks set ups in low priced stocks start working well between 15-25

Saturday, November 22, 2014

Finding Momentum Stocks Likely to Reverse

People like of the idea of buying low and then watching their stock immediately reverse and head higher.  That of course, rarely happens and people attempting to catch bottoms often watch their stock go much lower.   But let's see if we can turn the odds in our favor with a few tweaks to our framework.

Most significantly,  Let's only look at stocks that are in an uptrend.  I realize that is not the traditional reversal type trading, but I like to make money so I'm going to bet on proven winners. I'm not going for 10 baggers, but rather low risk trades that can add 3-6% to my equity in a few days.

  By way of example, I'm looking looking for something REG. A stock that has taken a rest after a nice run.  Its sold off, but the range has become narrower and eventually it goes green. Any buying pressure should spark a decent run.  Stops can be tight and positions size large to capture the renewed bullish move.


In Telecharts we can do this with the following formula:

avgc7/avgc65>=1.05   I also add a volume requirement to my scans to weed out stocks that are too thin to trade.

The TI65 formula produces a large number of stocks.  I got 845 running it this morning.  I have no interest in running through 845 stocks in addition to the other scans I run.

I wanted to find stocks that have pulled back a bit.  And since I tend to be impatient, I want to find stocks that are ready to resume their move now.

So I  then added another condition to the scan

"c>C1 and C1 < C2 and C2 < c3 and C3 < C4 and C4 <c5"

This provides stocks that are in an established uptrend thorough T165, but have sold off over the past week but have now stabilized and are ready to reverse.  On the maiden voyage for this scan I got the following results:  EXAS, LXFT, BIDU, CTSH, AGTC, BBRY, LBTYA, LBTYK, ABAX, BAH, REG, IDT, ESI, TXRH, MAR, SRCL, STE, TREE.

18 stocks.  Certainly more manageable than 845.  There are several stocks we can weed out right away.  such as LXTF.  This one gets cut because the selling pressure was not contracting so the last up day, is likely to be a relief rally that will be sold.  The bears are still in control:

In contrast EXAS, shows that the bears were exhausted and the bulls are back in control.

I'll probably tweak the formula a bit.  I'll see what happens if I reduce the number of days use an average so a minor up day would not break the formula etc...   But the idea will be the same.

Wednesday, October 22, 2014

Trading Against Yourself


Pundits are always trying to predict what the market will do. I've come to realize that trading is a game you play against your self more than anything else. Once I came to that realization, this game became a lot simpler. I don't need to predict what others will do, to be successful I need only predict what I will do under certain scenarios.

I know that every trade I put on comes with the baggage of my prior trades.  That is why it is so important in my opinion to develop the procedural memory and trade consistently.

My trade journal is the best weapon I have against my self.  By posting the good, bad, and ugly I cannot deceive myself (or anyone else) into thinking I have it all figured out.  I need only to trade out of my play book and follow my rules and plan for the trade.  When I do that I avoid the self destructive tendencies and thoughts that are the sirens steering many traders to the rocks of ruin.

So what are some of those sirens:

  • Fear of missing out on a big winner.
How many times have you been confident in a position and probably put on too much size only to see the trade not working.  So you wait a little longer because this could be the one.  Heck, you've probably counted the dollars you'll make when the stock doubles, triples or more.  It then trades down more and more and you wind up with a big loss.

I've been there. In fact, it was one such trade that caused me to start this blog in 2012.
  • Fear of being wrong
How many times have you refused to sell a position for a small loss because you just want to get back to even. So we see if it bounces at a support level, and then the next one, etc...  Even though I know the first loss is the best loss, I still find my self doing that from time to time.  

I very narrowly avoided such a disaster earlier this month.  I was short LAKE at  10.30.  I thought hey, I'll just go in small wait a few days to the hype passes and then put on size when It starts to fade. Thank God I came to my senses during A.H. trading as I watched LAKE tick up.  It tripled  over the next few sessions. 
  • Greed /Hubris
These ones always hits me when I'm on a winning streak.  The second I start thinking I can do no wrong,  and the market will come around to my way of thinking.  When I have these thoughts I've probably just bent a rule and am going to get my self in trouble.  
  • Regret
I sold XYZ too soon or I should have bought it when I first looked at it. So I'll buy ABC because its the next XYZ.  This siren's call plagues many new traders.  I noticed a lot of the late comers in the EBOLA rally were coming into the later movers with these types of emotions and mindsets. How many people were saying that VRS, APT, IBIO, HEB, and OBCI were going to pull lake like moves and go parabolic.  I was more than happy to sell the dream to the late comers as I got into some of names early and out quickly. 

Regret, in my opinion,  is the easiest sirens for traders to overcome.  You need only realized there is always another trade, there will always be another opportunity,  there is not only one golden ticket.  

Those are the pieces we all have to contend with. Whether we choose to recognize and combat our self-destructive tendencies will have more impact on our success in trading than reading all the market headlines, guru recommendations or earnings transcripts. 

Tuesday, October 21, 2014

Power Trigger BBRY

Look what I've reverse engineered.--The fabled Power Trigger Setup. So do I spill the beans so everyone can make their own ... or do I make people become my "special followers " before I share the details. Hmm.


Saturday, September 20, 2014

"what I learned Losing a Million Dollars" Book Review


Brendon Moynihan by Jim Paul. This was an interesting story about a CME trader that had a good run and then blew out.   

The lessons to be learned include:
1. Internalizing failure will keep you from rebounding.


"When you lose money, people tend to internalize that. They tend to equate self-worth with net worth," Moynihan says, referring to the way that people tend to equate their failures with their identity.
If you lose a massive amount of money or suffer another big setback, you will be holding yourself back from a rebound if you see yourself as a failure rather than someone who failed.
It was this fear of being a failure that kept Paul from aborting his investment in the soybean oil trade, despite multiple indicators of a sharply declining market, Paul and Moynihan write in their book. Looking back, Paul writes, he wishes he would have simply accepted the failure and moved forward before putting himself through even more difficulties.
2. There's a difference between risk-taking and gambling.
Being a smart investor requires taking many risks, and not all of them will result in success. But smart high-risk decisions are still very different from gambles, Moynihan tells Ferriss. Gamblers marry their ego to their money, which is what Paul did.
"They want to be right. It's not about the money. In gamblers, that is a disease... Money is just a ticket to enter. They're there for the adrenaline rush," Moynihan says.
3. Emotional decision-making is dangerous, especially when it's done as a group.
You're a human being. It's natural to have emotional reactions to situations, whether positive or negative. Just make sure you learn how to set feelings aside and look at something objectively before making a decision.

Sunday, September 14, 2014

Fishhook Update


 I've had a lot of questions about how I find big gain stocks and trade them with the Fishhook setup.  This post is a follow up on my initial description of this set up


The Fishhook Setup that I described has been performing extremely well.  It has performed much better than the range expansion breakout that I also trade--which has had limited follow through the past few weeks. 


Thursday, September 4, 2014

The Fishhook Set up

Lately, I've noticed that there are a lot of stocks making some big moves.  I've been using a fishhook entry on these stocks with a lot of success.  


Sunday, August 31, 2014

If only...

"If 'ifs and buts' were candy and nuts we'd all have a merry Christmas." -- Don Meredith


I frequently see people on stocktwits and other message boards making comments along the lines if only I would have bought XYZ stock, or sold ABC stock at such and such price. I too was guilty of such thinking, I can't count the number of times I would think to myself "if only .."

Thursday, May 29, 2014

Study: Trade or Fade?

Here's a chart that I'm sure the technicians would love. Great consolidation (inverse H&S?) and now a breakout. If this continues to run, it could wind up in a trading book as a perfect example.


That being said, I had noticed the consolidation and likelihood that HA could run last week.  Yet,  I decided I  did not want take the breakout trade and that this might be better as a "Fade."  The reason is that I don't see the fundamentals justifying a large run here. 

Revenue has steadily grown over the years but is subject to larger seasonality differences among quarters

 The Price to Sales Ratio shows that HA is trading at a relatively high ratio for itself.  When it began the run where it doubled it did so when the p/s ratio was at lows for this stock.  I would question how much higher could the ratio go when it would be starting the next run at a relatively high p/s ratio and the stock price appreciation has began outpacing the revenue growth.


The point of this exercises is to see if we can ascertain the degree that certain fundamental measures  are necessary to provide the structural support to sustain a larger move or is the chart really everything.  The next week should tell.

I have no position in HA.