Saturday, April 19, 2014

Book Notes: Contrarian Investment strategies: By David Dreman

The market operates partly on fundamentals and partly on investor psychology.  When these market drivers can diverge significantly and for extended periods of time.   I like contrarian plays.

The Affect principle.

Our expectations can be skewed by our like or dislike of a particular stock.  Also, recent events skew our expectations.  BP oil spill, gun stocks after school shootings caused stocks to over react.


Risk is not correlated to reward in the investment world.  Studies have demonstrated that "low risk" investments out perform the perceived high risk.  But we are programed to believe the converse to be true.

Dreman Guidelines


  • Do not abandon the prices projected by careful security analysis, even if they are temporarily far removed from current market prices.  Over time the market prices will regress to the levels similar to those originally projected.


  • Warning signs include analysts justifying prices with metrics outside traditional analysis.
SOS thought: Social media stocks are being valued from the stand point of  viewers rather than earnings. 

Treacherous short cuts

Availability heuristic.

  • Don't be seduced by recent rates of return when they depart significantly from historical rates.
  • The market may react to news, but it does not always react correctly.


Sunday, April 13, 2014

The Market is Psychology

The market does not trade on value.  It trades on perception of value.   This portion of the Speculations will discuss crowd psychology.  How we measure it, why it turns, and when it is changing.

The underlying logic behind technical analysis is that it depicts the psychology of the investors of a stock, which is used to "forecast" price.  I think we need to divorce ourselves from the belief of forecasting price and instead focus on what the chart's say about the other investors (our opponents).   Are they becoming greedy, fearful, or unsure of their positions?

Consider a double top:

The failure to go higher on the second push suggests that everyone that wants to be long in is already in and no one wants to pay more.    Seeing a second high, however is not enough.  I would want to use an oscillator such as the force index and look at the MACD.  It should reflect that the buying pressure is not as strong.  In which, case we would look to go short.

Breadth Indicators

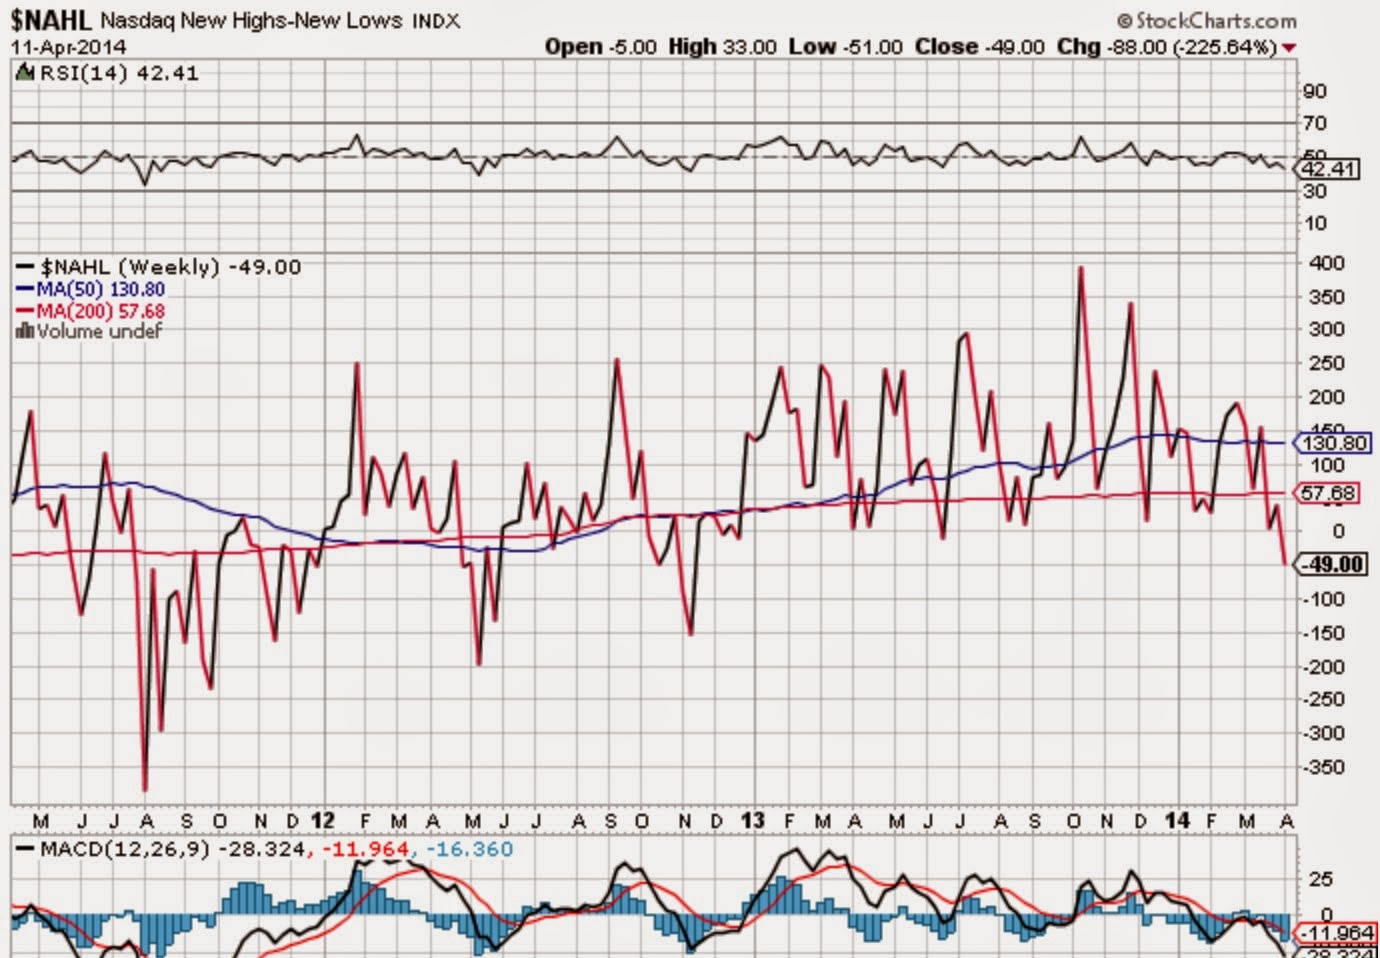
What does a market that is making new highs or new lows tell us? When we get extreme values it is easy to call a bottom or a top.  But what is extreme?  On the weeklies,  in August  11' there was a high reading of new lows, which seemed to correspond with a bottom.  In Jan 12 there Was a spike to the upside, yet the market continued to drift much higher: 


I agree that we want to trade in the general direction of this index.   But if you take a position in the same direction as a "spike" you are susceptible to a harsh reversal.

I'm not sure that the indicator does that great of a job ferreting out the extremes on a weekly chart.  I've personally found daily High/low Indicators better for determining divergence of rallies.