When I enter a short term trade, the 5 by 6 signal. Using the 5 min chart with a 6 ema as guidance by the cross over for a trend change. My XBIT trade this morning used the signal and worked to perfection.
Showing posts with label Setups. Show all posts
Showing posts with label Setups. Show all posts
Tuesday, July 5, 2016
Friday, November 27, 2015
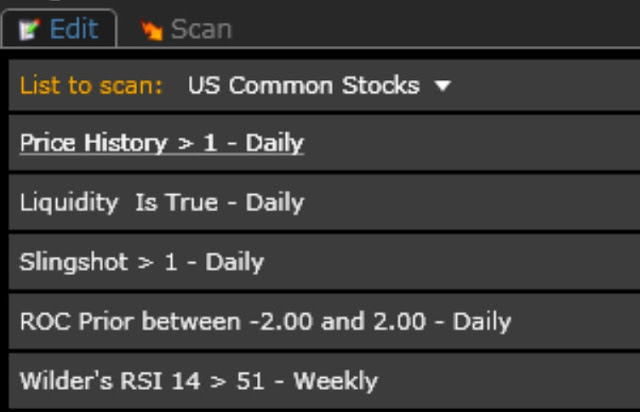
New Slingshot Anticipation Scan
A friend of mine has shown me the value of using Rate of Change to identify compression points in a stock. We talked about combining a Slingshot in the current bar with a ROC of +/- 2 in the preceding bar. He personally also conditions a ROC of >15 in the prior 21 bars but since my coding knowledge is more limited, I went after the concept it in a slightly different way by using a weekly RSI > 51 for now. I'll likely experiment some more, but I like what I see from this scan so far.
As I'm very encouraged by what It has produced, I've decided to share the scan.
Criteria:


As I'm very encouraged by what It has produced, I've decided to share the scan.
Criteria:
Price = personal preference
Liquidity is true = minv3.1 >=55000 -- Personal preference
Slingshot = c > xavgh4 and c1 < xavgh4.1 and c2 < xavgh4.2 and c3 < xavgh4.3
ROC (my work around TC2k Limitations) = ((C1/c6)-1) *100
Wilder RSI > 51 weekly -- Self explanatory, but subject to experimentation.
Results: 11/27/15:
Sunday, November 8, 2015
Slingshot Setup Described
Here's the main setup I've been using lately. It is a range breakout following a pullback in power stocks.
Wednesday, October 21, 2015
Thrust--
I'm working on refining the trigger for my slingshot setup. If I combine the setup with my "Thurst" indicator: -- a 4EMA of the HIGHS -- --- This setup is to target a reversal of a shallow pull back. I would consider any new thrust as anything more that 4 pull back bars.
NOTE: I do not keep my charts this messy ... this is for illustrative purposes only.
I'm encouraged with what I see:


NOTE: I do not keep my charts this messy ... this is for illustrative purposes only.
I'm encouraged with what I see:


Sunday, October 18, 2015
Al Brooks Price action Trading course
A friend shared me this video on price action trading.
Most things work 40-60% of the time. There is no holy grail.
5% of the time market is in a strong breakout, no decision trade in the direction of the trend.
In 5% clear trend. -- Ascertain direction and get in quickly. Buy close of bull bars- pull backs.
95% not in a pure trend-- both bulls and bears can make money.
Initial risk, every trader has initial risk that is different.
Actual risk.--- number of ticks needed to not take a loss on that trade.
Target needs to be as big as risk.
When probability not in trend. need 2x risk.
Wider stop = smaller size.
A lot of profit at 1 x 2 times risk. Computer driven.
Assume institutions are profitable. Always an institutional seller and buyer. In general there is balance.
Most things work 40-60% of the time. There is no holy grail.
5% of the time market is in a strong breakout, no decision trade in the direction of the trend.
In 5% clear trend. -- Ascertain direction and get in quickly. Buy close of bull bars- pull backs.
95% not in a pure trend-- both bulls and bears can make money.
Initial risk, every trader has initial risk that is different.
Actual risk.--- number of ticks needed to not take a loss on that trade.
Target needs to be as big as risk.
When probability not in trend. need 2x risk.
Wider stop = smaller size.
A lot of profit at 1 x 2 times risk. Computer driven.
- Take partial profits at min equation as of 2x actual risk.
- There is a profitable way to manage both short and long
Assume institutions are profitable. Always an institutional seller and buyer. In general there is balance.
- Market spends most of the time at point of the control.
PROBABLILTY IS THE SOURCE OF ALL EMOTION OF TRADER
- Makes beginners not entry too early or too late
- Reward should be at least equal to risk.
- if uncertain 40-50% of the time--- need 2x risk.
- Institutions can enter profitably on any tick on the day. They have a profitable strategy and employ it.
- Hedge in other markets
- Our edge is to trade setups. Always near support or resistance. Risk is small-- buying on support or probability is high.
- Profits disappear quickly.. take at least 1/2 at profit target.
Buying breakout --- there's an institution betting on failure of breakout.
Trading only profitable market structures.
Short at the bottom of a trading range should not be fighting with 2 sided trading.
Saturday, October 17, 2015
2 Week Rest Rule
One of Mauthe's criteria is that a new breakout must rest for 2 weeks before re-breaking out. Here's an example of this "rule" in action:

Weekly:

Weekly:

Wednesday, August 19, 2015
Trading With SK
There's a contingent of loud mouths on Twitter that look to short every parabolic move. It works well, until it doesn't and they get run over. That method has great winning percentages but risk blowing out an account in 15 minutes if their wrong.
Then there's the guys that know that it is far better to prey on the weak. The pack of wolves doesn't go after the strongest buffalo .. they hunt the weak.
My Friend SK (feel free to follow him on twitter) goes after the weakest stocks. The dude prints money. And he's not trying to sell anything. No memberships, DVDs handbooks, he's giving away his advice. He has been very generous of his time and his secretes. I must admit due to my schedule and a full time job - I can't keep up with his pace. That said, I've adapted many of his techniques for my swing trading.
He put a video together a video describing his method in detail, check it out.
Monday, August 17, 2015
Introducing the Slingshot
Over the weekend, I spent some productive time working out a new power setup with a couple of my
trader friends. We are fondly calling this setup the "Slingshot."
This setup takes a stock that recently had a power move and has stretched back under the EMA 4 --- but not too far-- The EMA 9 should be the limit. When it gets pulled back through the green side of the EMA 4 it has accumulated power and is ready to go.
The great thing about this setup is that it gets you in power stocks sooner, with tighter stops then waiting for a breakout.
Here's a perfect example: EFOI gets stretched through the 4 to the 9. I picked it up at 13.24 as it came back through.

How did it do? Only about 40% in the next 2 days.

TREE:
 Aftermath: +20pt move and counting

SPNS:

EVHC:

Under the surface:
I'm a big fan of hourly charts. The weekly gives you the trend. The daily gives you the landscape, but it is the hourly that gives you the entry.
That said, I can get jumpy and I did this morning in ALJ. It retook the 4 and broke the hourly downtrend channel in the first inning of today. So I took a position. It was stuffed and I took a stop.
I'd be far better off waiting for 2 hour bars for confirmation.

Done correctly:

Follow through:
After the Slingshot shoots, the EMA 4 should never be breached on a close. Consider it the trailing stop on the position. Of course, take profits on the way up.
After I presented, this post I had a follow up question as to how this differs from the Fishhook. There are two significant differences.
First, is the timing. The Fishhook was designed for Week 1 moves. Power move rest two days and boom!

The second is the trigger point. The fishhook buys on confirmation when the first day high is taken out. The Slingshot buys lower when the 4EMA is reclaimed. (but again consult the shorter timeframe such as the hourly-- we want to see a break of the downtrend channel)
trader friends. We are fondly calling this setup the "Slingshot."
This setup takes a stock that recently had a power move and has stretched back under the EMA 4 --- but not too far-- The EMA 9 should be the limit. When it gets pulled back through the green side of the EMA 4 it has accumulated power and is ready to go.
The great thing about this setup is that it gets you in power stocks sooner, with tighter stops then waiting for a breakout.
Here's a perfect example: EFOI gets stretched through the 4 to the 9. I picked it up at 13.24 as it came back through.
How did it do? Only about 40% in the next 2 days.
TREE:
SPNS:
EVHC:
Under the surface:
I'm a big fan of hourly charts. The weekly gives you the trend. The daily gives you the landscape, but it is the hourly that gives you the entry.
That said, I can get jumpy and I did this morning in ALJ. It retook the 4 and broke the hourly downtrend channel in the first inning of today. So I took a position. It was stuffed and I took a stop.
I'd be far better off waiting for 2 hour bars for confirmation.
Done correctly:
Follow through:
After the Slingshot shoots, the EMA 4 should never be breached on a close. Consider it the trailing stop on the position. Of course, take profits on the way up.
After I presented, this post I had a follow up question as to how this differs from the Fishhook. There are two significant differences.
First, is the timing. The Fishhook was designed for Week 1 moves. Power move rest two days and boom!
The second is the trigger point. The fishhook buys on confirmation when the first day high is taken out. The Slingshot buys lower when the 4EMA is reclaimed. (but again consult the shorter timeframe such as the hourly-- we want to see a break of the downtrend channel)
Saturday, August 1, 2015
The Dollar Scan.
The $dollar scan is simple but effective stock that many of the top traders look for is stocks that are in play for the day.
Here's the easy you can do it in TC2000
Step 1:
Right Click on symbol in Price chart
Create Easy Scan.
Step 2
pick up moving up net
pick $1
Step 3:
Select your stock universe and liquidity conditions.

Here's the easy you can do it in TC2000
Step 1:
Right Click on symbol in Price chart
Create Easy Scan.
Step 2
pick up moving up net
pick $1
Step 3:
Select your stock universe and liquidity conditions.
Tuesday, June 30, 2015
How to look through a chart.
There's a reason why I haven't updated my trade journal since last week:

Nice right. I cut my positions going into vacation. The ones I didn't cut I should have and I eventually closed them
I'm doing some mental trading exercises and thinking a lot through my trading strategies, psychology and results. I added a small ONTY position this morning to help me concentrate on my thoughts. Here is how a work through a chart and make a buy decision.
ONTY:
On the monthly we had a gap ... monthly gaps usually do not last and this recently filled and bounced right on the monthly. We had a gap up on the early part of the month which has made the bar red. That said, this is a legitimate move that just needed to gap fill. That has now occurred as of yesterday. Today It bounced back hard. and I bought Entry 3.72.
Now to the weekly: Buyers fought off the breakdown attempt. The gap filled and rallied back up.
Hourly: RSI pops back from oversold levels:
Thursday, May 28, 2015
Post Trade Analysis -- SALE
Losses happen, that is a fact a of trading.
Here's a recent one I had. On this trade I took an .80 loss on SALE, which was about .05% of my equity so good risk management. Had I just looked at the P&L I would not have realized my mistake.
But As I was going through my scans this jumped out at me as it was a trade I misanalysed the buy point and should not have taken where I did. Some times a clean slate brings clarity and I now see my mistake.
The mistake I made was where I drew my breakout line. I used the November high, which caused me to buy into an extended stock on the weekly.

The correct point at 18.97. I should have taken this trade on a break out 19. Which would have made this trade a decent winner instead of buying it in the $20.30s which made it a loser.
Monday, May 25, 2015
Watch past power for future gains.
Here's a stock I've got my eye on. It's not an entry yet, but something definitely worth watching.
Post Script: This was never in stage 2 and not a good setup:
Sunday, May 24, 2015
Breakout Entries on Multiple Time Frames
Here's a quick video about the trades I took Friday and what I was looking at when I took them.
Tuesday, May 5, 2015
How I set Up My Charts and Momentum Scans
When scanning for Momentum stocks, I to keep several scan windows with the criteria I am searching for so that I can sort it easy.

The first window "Top Momentum" is all stocks that meet my liquidity stocks. I generally keep this scan organized by stocks with the highest "MDT Daily" level.
The Next Window "Power" is my bread and butter scan. That is the Scan for the 3 year RSI high. I can sort it for various criteria that I find useful. MDT, Small Floats. I have MACD column that I can see are checked for confirm.
Finally, I have a window for IPOs because I find the IPOS to be profitable trading vehicles after the initial washout.
I set my "Big Gain Hunting" chart, up as follows:
- Starting view is the Weekly
- I find that it filters out the he noise the best.
- I will then look at other time frames when contemplating trades
- Wilder RSI. -- self explanatory. With breakout trades I like them above the Green line.
- But when hitting the red on a weekly. That gets a bit hot
- price chart. I look at hundreds of charts and set the price alerts.
- I like simple charts so I only include a 10 and a 4 EMA on the chart.
- Volume: nothing special -- I have an 20 day ma /4 week avg. to let me know whether volume is significant or not.
- MACD: I combined my fast and normal MACD in one window. It is easy enough to see.
- % to magic line. I prefer taking trades that are close to the 10 Week Avg. Breakout trades do not have to be extended.

Saturday, April 18, 2015
Review of www.Stockbee.biz
I thought I would do a post about the stock trading sites I subscribe to, why I subscribe to them, and how I am trading the setups utilized by those sites.
The trading community that I have been a a member of the longest is a momentum trading group called
Stock Bee.

Stock Bee is run by Pradeep Bonde (a/k/a Easy Guru). I followed his free blog for over a year before taking the plunge and becoming a member. I have been a member for about 8 months now. I believe its about $300 for the year. It is an excellent value for the expense.
Subscribers are afforded access to a vibrant community with some excellent traders. You will find that there a number of different strategies that are traded and members are very helpful showing the ropes to new traders and sharing the nuances of their setups and systems to each other.
You will not find stock picks here. I like to tell my friends that Stock Bee trades setups not stocks. By that I mean, there is a hyper focus on the quality of individual setups but there is little to no discussion of the fundamentals for those stocks.
With that caveat, the bread and butter setups taught by Stock Bee is the the "Momo Burst". The Momo Burst was a significant part of my trading strategy and a big reason why I made 47% last year.
A momo burst looks for:
(1) stocks in an uptrend (preferably the beginning of a new trend)
(2) a period of range contraction
(3) a range expansion that is bought
(4) a 3-5 day move
Risk Mangement:
(1) stops generally placed at the low of the day. Stop hunting algos? We don't care a good burst should never look back.
(2). EG's trade risk is usually around .25-.5 per trade, But I usually go 5 to .75 of my equity on a trade.
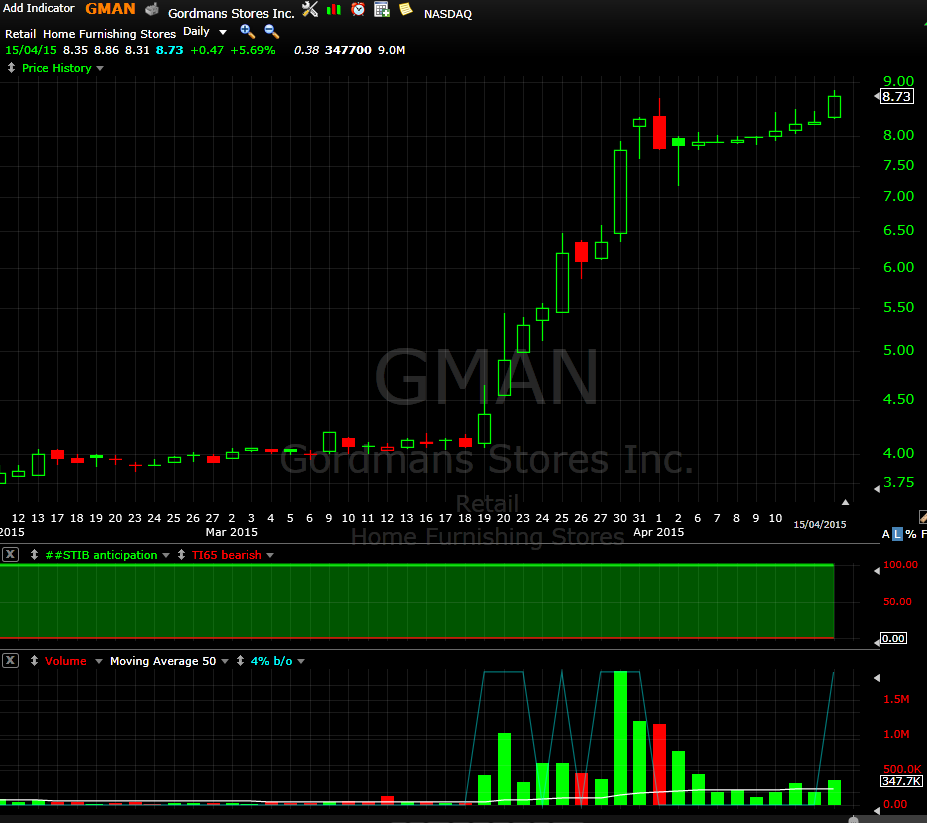
Stock's Free Blog highlighted GMAN as good setup and it is a perfect example of what an ideal momo Burst would look like.
It had a very powerful move and has then entered range contraction and on the right edge expanded.
PROS:
This set up appears 1000s of times a year.
Many opportunities to practice the trade
A postive expectancy.
CONS:
Are you mentally prepared to make 100s of losing trades a year? 10 loses in row?
Can be mentally exhausting
My Experience
I had a 57% win rate in 2015 and an avg win / loss 1.03 / 1.00. So not great but that small edge builds up over time. Even so, I can attribute a lot of my gains to just a few trades. For example, I had a trade in RWLK I risked . 25% of my account and made 6.6% gain on my account on just a 1 day Burst.
My chief disappointment with the system is that there are a ton of failed range expansions and also there were a number of burst I sold for 5-8% gain winners on stocks that would run 100-200% from that point.
I want the monster moves!
The "Episoidic Pivot" The EP trade is supposed to go after the monster move. The Theory is that a stock goes through an major game changing event such as fantastic earnings after being neglected for years. Stock Bee's summary is here.
On an EP you want to buy as soon as it happens even pre-market and your looking for 50% + gains moves. You want to see massive volume and a gain changing news:

Pros:
The gains can be enormous. Jesse Stine used this type of strategy to take his account from 46K to over 6 Million in under 3 years.
Cons:
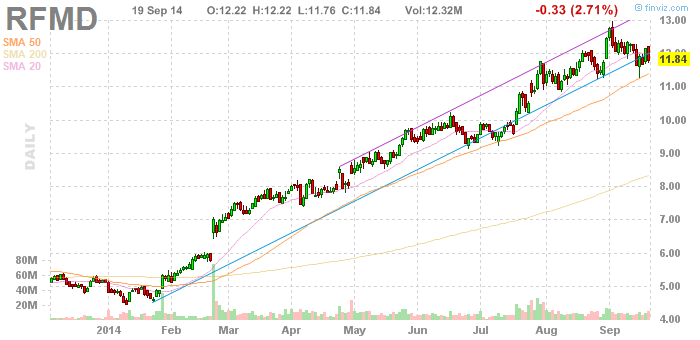
The setup appears infrequently. The only EP I've had were NOK when it sold it's phone division to MSFT and RFM when it merged with TQNT.
 My Experience:
I've been awful with this setup. The true EP appears infrequently and there are many false positives. If you are buying pre-market gaps on non-EP's you usually get stuffed. A lot of times great earnings can be subjective, and how do you really know whether a bio tech's news on a phase 1 or 2 trial really has significance?
I've also noticed that there are many stocks that make fantastic 100% +moves without ever having a true "EP"
It is these stocks that I've been studying and trying to figure out how do I get in them. Perhaps there's a way to quantify an EP type stock without having to read the tea leaves in press releases?
Update 2018:
My favorite part of stockbee is the forum-- which I affectionately call the beehive. There are many different styles of traders in the room. Although I've since moved to a longer term focus since first joining, there are other traders in the group that use my approach. Others are 100% mechanical and there are a few day traders.
The people I've met in the group include people that that have placed in trading competition and are now doing national speaking engagement. So its an amazing opportunity to learn from some great traders. I have benefited immensely from the free flow of ideas.
The trading community that I have been a a member of the longest is a momentum trading group called
Stock Bee.
Stock Bee is run by Pradeep Bonde (a/k/a Easy Guru). I followed his free blog for over a year before taking the plunge and becoming a member. I have been a member for about 8 months now. I believe its about $300 for the year. It is an excellent value for the expense.
Subscribers are afforded access to a vibrant community with some excellent traders. You will find that there a number of different strategies that are traded and members are very helpful showing the ropes to new traders and sharing the nuances of their setups and systems to each other.
You will not find stock picks here. I like to tell my friends that Stock Bee trades setups not stocks. By that I mean, there is a hyper focus on the quality of individual setups but there is little to no discussion of the fundamentals for those stocks.
With that caveat, the bread and butter setups taught by Stock Bee is the the "Momo Burst". The Momo Burst was a significant part of my trading strategy and a big reason why I made 47% last year.
A momo burst looks for:
(1) stocks in an uptrend (preferably the beginning of a new trend)
(2) a period of range contraction
(3) a range expansion that is bought
(4) a 3-5 day move
Risk Mangement:
(1) stops generally placed at the low of the day. Stop hunting algos? We don't care a good burst should never look back.
(2). EG's trade risk is usually around .25-.5 per trade, But I usually go 5 to .75 of my equity on a trade.
Stock's Free Blog highlighted GMAN as good setup and it is a perfect example of what an ideal momo Burst would look like.
It had a very powerful move and has then entered range contraction and on the right edge expanded.
PROS:
This set up appears 1000s of times a year.
Many opportunities to practice the trade
A postive expectancy.
CONS:
Are you mentally prepared to make 100s of losing trades a year? 10 loses in row?
Can be mentally exhausting
My Experience
I had a 57% win rate in 2015 and an avg win / loss 1.03 / 1.00. So not great but that small edge builds up over time. Even so, I can attribute a lot of my gains to just a few trades. For example, I had a trade in RWLK I risked . 25% of my account and made 6.6% gain on my account on just a 1 day Burst.
My chief disappointment with the system is that there are a ton of failed range expansions and also there were a number of burst I sold for 5-8% gain winners on stocks that would run 100-200% from that point.
I want the monster moves!
The "Episoidic Pivot" The EP trade is supposed to go after the monster move. The Theory is that a stock goes through an major game changing event such as fantastic earnings after being neglected for years. Stock Bee's summary is here.
On an EP you want to buy as soon as it happens even pre-market and your looking for 50% + gains moves. You want to see massive volume and a gain changing news:
Pros:
The gains can be enormous. Jesse Stine used this type of strategy to take his account from 46K to over 6 Million in under 3 years.
Cons:
The setup appears infrequently. The only EP I've had were NOK when it sold it's phone division to MSFT and RFM when it merged with TQNT.
I've been awful with this setup. The true EP appears infrequently and there are many false positives. If you are buying pre-market gaps on non-EP's you usually get stuffed. A lot of times great earnings can be subjective, and how do you really know whether a bio tech's news on a phase 1 or 2 trial really has significance?
I've also noticed that there are many stocks that make fantastic 100% +moves without ever having a true "EP"
It is these stocks that I've been studying and trying to figure out how do I get in them. Perhaps there's a way to quantify an EP type stock without having to read the tea leaves in press releases?
Update 2018:
My favorite part of stockbee is the forum-- which I affectionately call the beehive. There are many different styles of traders in the room. Although I've since moved to a longer term focus since first joining, there are other traders in the group that use my approach. Others are 100% mechanical and there are a few day traders.
The people I've met in the group include people that that have placed in trading competition and are now doing national speaking engagement. So its an amazing opportunity to learn from some great traders. I have benefited immensely from the free flow of ideas.
Friday, March 20, 2015
Fishhook Update
After studying my Fishhook trades over the past year. I've made a few tweaks.
1-2-3 Go!
I've learned that buying before a 2 day rest is dangerous. It is chasing a stock that have already run. We want safer entries into extreme momentum stocks. On REPH, I executed the 1-2-3- go rule perfectly this past week as it made a 40% 2 day burst.

UPDATE:
In the previous chart, I said this was ready to go.. 3 days later it hit $9.93 for a 15% move.

This was a lesson I've learned the hard way.
CAPN. I could see the Fishhook forming but I jumped it:

Had I waited for the 1, 2, 3, go, I would have gotten the buy signal the next day and a 35% 2 day move:

If a breakout before day 3 it is not Fishhook. Buying a day 1 or day 2 is buying a continuation pop on an extended stock:
IPOS:

Aftermath:
Although the initial gap faded, the next day--the 1,2,3 go day-- pushed higher. Admittedly this would be a more difficult breakout to buy than a breakout from linear action such as reph, but it nonetheless could be bought with a stop at the gap.

I personally think that it would be easier to buy off the next breakout as FRSH now has nice tight consolidation. A range expansion breakout next over $18.30 would present an ideal entry:

Risk Management: Fishhooks on a daily timeframe are short term trades. They should last 2-4 and hold the breakout.
Hold the Breakout --- preserve capital.
A good move should hold the breakout at a minimum. I got a Fishhook signal in LBIO yesterday. I took it, buying the breakout at 13.80:
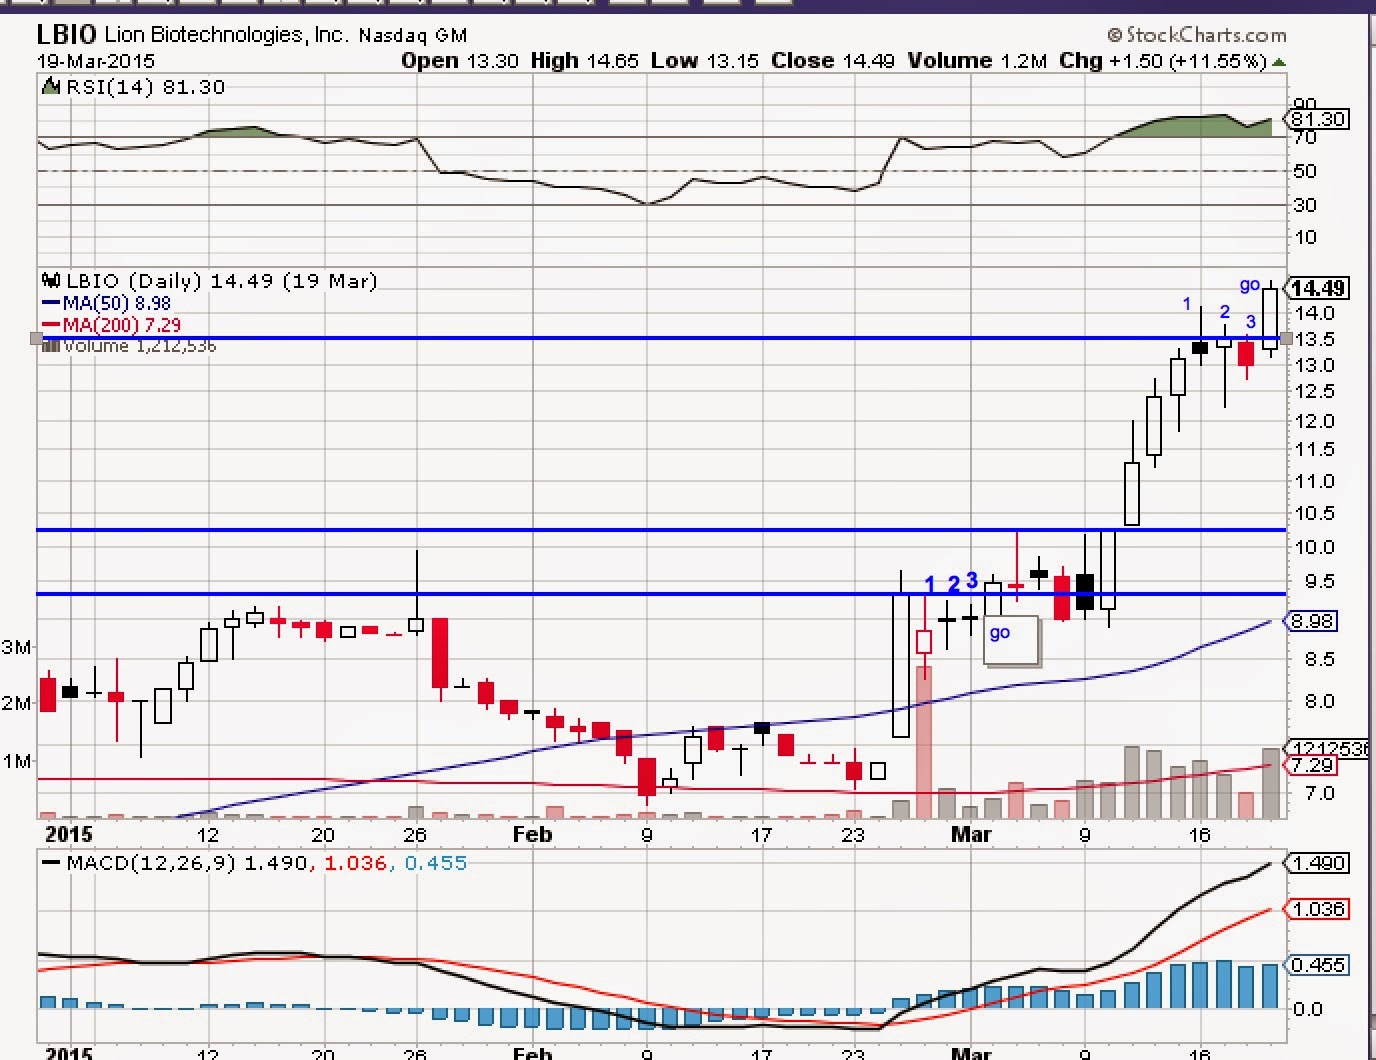
Be wary of Gaps:
Most investors talk about gap ups as if it is a positive. I hate them. As gaps often put in a ceiling. Today, LBIO Gapped to $15. That sounded alarm bells for me. Often the Gap signals a reversal in the works. If a fishhook gaps... do not let it go negative. On this one I raised my stop to $14.35. So I made $.55 on this failed fishhook. I should have raised to yesterday's close but still not a bad result for a failed breakout.

Safety Nets:
I've had a number of Fishhooks do remarkably well and others make me look foolish. I've since studied why some work and other don't. I've since determined that RSI works very well as a filter.
Here's one that failed. I bought Day 2,

Buying early was my first mistake but the second mistake was that this stock had a very poor relative strength on a weekly:
 Another Fishhook fail: Note that the Weekly RSI was not over 70.
 But a fishhook Win:
 The weekly RSI and MCAD at the time were the highest for the year.

TIME FRAME
Its important to know what time frame the breakout is occurring. On REPH the daily is setup for a fishhook as described above, but on the weekly its extended. As a result, taking a fishhook on a daily, requires the exit to be taken on a daily frame.

A stock that is setup for a fishhook on a weekly may be held for a longer period when the breakout occurs. PFNX looks like it is setup three narrow range days. Any breakout above 15 can be bought:
PFNX.

Aftermath: Boom! run to $19.

Conclusion:
1-2-3 Go!
I've learned that buying before a 2 day rest is dangerous. It is chasing a stock that have already run. We want safer entries into extreme momentum stocks. On REPH, I executed the 1-2-3- go rule perfectly this past week as it made a 40% 2 day burst.
UPDATE:
In the previous chart, I said this was ready to go.. 3 days later it hit $9.93 for a 15% move.
This was a lesson I've learned the hard way.
CAPN. I could see the Fishhook forming but I jumped it:
Had I waited for the 1, 2, 3, go, I would have gotten the buy signal the next day and a 35% 2 day move:
If a breakout before day 3 it is not Fishhook. Buying a day 1 or day 2 is buying a continuation pop on an extended stock:
IPOS:
Aftermath:
Although the initial gap faded, the next day--the 1,2,3 go day-- pushed higher. Admittedly this would be a more difficult breakout to buy than a breakout from linear action such as reph, but it nonetheless could be bought with a stop at the gap.
I personally think that it would be easier to buy off the next breakout as FRSH now has nice tight consolidation. A range expansion breakout next over $18.30 would present an ideal entry:
Risk Management: Fishhooks on a daily timeframe are short term trades. They should last 2-4 and hold the breakout.
Hold the Breakout --- preserve capital.
A good move should hold the breakout at a minimum. I got a Fishhook signal in LBIO yesterday. I took it, buying the breakout at 13.80:
Be wary of Gaps:
Most investors talk about gap ups as if it is a positive. I hate them. As gaps often put in a ceiling. Today, LBIO Gapped to $15. That sounded alarm bells for me. Often the Gap signals a reversal in the works. If a fishhook gaps... do not let it go negative. On this one I raised my stop to $14.35. So I made $.55 on this failed fishhook. I should have raised to yesterday's close but still not a bad result for a failed breakout.
Safety Nets:
I've had a number of Fishhooks do remarkably well and others make me look foolish. I've since studied why some work and other don't. I've since determined that RSI works very well as a filter.
Here's one that failed. I bought Day 2,
Buying early was my first mistake but the second mistake was that this stock had a very poor relative strength on a weekly:
TIME FRAME
Its important to know what time frame the breakout is occurring. On REPH the daily is setup for a fishhook as described above, but on the weekly its extended. As a result, taking a fishhook on a daily, requires the exit to be taken on a daily frame.
A stock that is setup for a fishhook on a weekly may be held for a longer period when the breakout occurs. PFNX looks like it is setup three narrow range days. Any breakout above 15 can be bought:
PFNX.
Aftermath: Boom! run to $19.
Conclusion:
- A fishhook Must rest at least 2 days. Remember 1, 2, 3, GO!
- A good fishhook holds the breakout. Take the breakout preserve capital by moving stops to breaking point.
- continuation gaps are yellow flags. Any Gap requires moving stop to prior day close.
- Use the RSI and MACD for the time frame above what you are trading. If these are not setting new highs. DO NOT TAKE THE TRADE!
Subscribe to:
Posts (Atom)