Sunday, May 31, 2015
The Breakout Project
I'm currently working with a trader who is interested in trading momentum. He asked me to walk him through the process of analyzing stocks from a particular scan he is using. Here's the video.
Thursday, May 28, 2015
Post Trade Analysis -- SALE
Losses happen, that is a fact a of trading.
Here's a recent one I had. On this trade I took an .80 loss on SALE, which was about .05% of my equity so good risk management. Had I just looked at the P&L I would not have realized my mistake.
But As I was going through my scans this jumped out at me as it was a trade I misanalysed the buy point and should not have taken where I did. Some times a clean slate brings clarity and I now see my mistake.
The mistake I made was where I drew my breakout line. I used the November high, which caused me to buy into an extended stock on the weekly.

The correct point at 18.97. I should have taken this trade on a break out 19. Which would have made this trade a decent winner instead of buying it in the $20.30s which made it a loser.
Monday, May 25, 2015
Watch past power for future gains.
Here's a stock I've got my eye on. It's not an entry yet, but something definitely worth watching.
Post Script: This was never in stage 2 and not a good setup:
Sunday, May 24, 2015
Breakout Entries on Multiple Time Frames
Here's a quick video about the trades I took Friday and what I was looking at when I took them.
Remembering Brian. (a/k/a Trader Vancouver)

I recently learned that one of the Trader Vancouver --one of the traders that was an inspiration to many
on the stock twits community has passed away. Brian had thousands of followers ---2931 to be exact--- and
with good reason. He planned his trades and followed his trading plan. He was always helpful to others and
quick to answer questions.
I was absolutely thrilled when Brian followed me on Stock Twits. If someone so recognized in the field
found my market musings worth while maybe I was on to something. We began corresponding about
trades shortly afterwards. He subsequently wrote blog post about about why he followed me I was truly
humbled.
Brian was quick to note when I took a trade that did not meet my normal criteria that is to say, he probably
knew how I traded as well as I did.

Truly a class act. Brian, you will be missed. Rest In Piece.
Saturday, May 16, 2015
Creating Momentum Watch lists
One of the things that many new traders struggle with is how to create watch lists. Many services give stock "picks" but don't tell you how to scan for those stocks or how to create your watch list.
My approach to trading generally focuses on trading weekly breakouts. The reason I like weekly breakout is because the win rates and gains tend to be higher than on shorter time frames. I'll pull back the curtain and show how I do my analysis and stock selection.
Saturday, May 9, 2015
Finding Power Breakouts
I made this video for a trader I am mentoring. He asked me about some specific stocks and my process for going through my scans.
Thursday, May 7, 2015
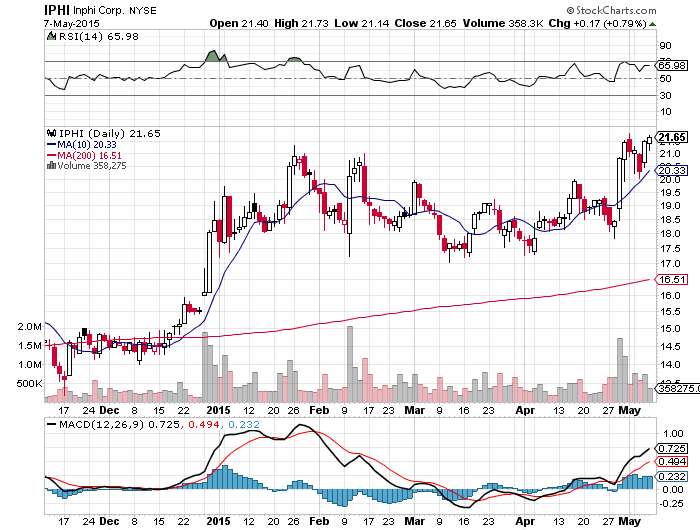
Breakout Research
Steve Stewart's Picture of Power chart list has been inspiration for what I'm doing. The problem I've encountered however is often Weekly Breakouts are susceptible to violent pull backs on a daily.

As good as that breakout looks on a weekly, on a daily it would be rough daily-- pulling back nearly 10% to the 10 day avg. and prior 3 month high. Supported and then bounced.
Tradable strategies
- Perhaps a better entry is to look for a pull back within the weekly breakout to support?
- Take Week one -- Exit after 2 consecutive weeks of now new highs
Tuesday, May 5, 2015
How I set Up My Charts and Momentum Scans
When scanning for Momentum stocks, I to keep several scan windows with the criteria I am searching for so that I can sort it easy.

The first window "Top Momentum" is all stocks that meet my liquidity stocks. I generally keep this scan organized by stocks with the highest "MDT Daily" level.
The Next Window "Power" is my bread and butter scan. That is the Scan for the 3 year RSI high. I can sort it for various criteria that I find useful. MDT, Small Floats. I have MACD column that I can see are checked for confirm.
Finally, I have a window for IPOs because I find the IPOS to be profitable trading vehicles after the initial washout.
I set my "Big Gain Hunting" chart, up as follows:
- Starting view is the Weekly
- I find that it filters out the he noise the best.
- I will then look at other time frames when contemplating trades
- Wilder RSI. -- self explanatory. With breakout trades I like them above the Green line.
- But when hitting the red on a weekly. That gets a bit hot
- price chart. I look at hundreds of charts and set the price alerts.
- I like simple charts so I only include a 10 and a 4 EMA on the chart.
- Volume: nothing special -- I have an 20 day ma /4 week avg. to let me know whether volume is significant or not.
- MACD: I combined my fast and normal MACD in one window. It is easy enough to see.
- % to magic line. I prefer taking trades that are close to the 10 Week Avg. Breakout trades do not have to be extended.

Sunday, May 3, 2015
Alexander Elder "Trading For A Living" Seminar.
Alexander Elder's books were very instrumental to me. Here is a great seminar.
Your odds at the onset:
- Average time for a speculator in the market is 2 years
- 98% of traders lose money
Take Aways
- Trading can be like alcoholism
- Once you look for excitement in the markets you are finished
- Compares Losers Anonymous
- I can do serious financial damage to my account, I've done it before and I can do it again. My only goal today is to trade sober.
- Find discipline
- Trade journal
Saturday, May 2, 2015
How To Develop A Trading Strategy
As traders, we talk a lot about trading strategies and various setups. As helpful as that can be, I recognize that what is often lost is how traders we developed our respective trading strategies.
If you are a new trader you are probably thinking of where, or how do I begin? I've been there too. Before making the mistake of jumping to setup to setup, strategy to strategy, guru to guru, here's where I would recommend beginning.
Observe the Best Performing Stocks
"A lot of people miss opportunity because it is dressed in overalls and looks like work."--Thomas Edison
Putting the work in is the only way to have enough confidence to trade your strategy. Start studying Studying the stocks that make 8%-10% gains in a week, 20% moves in a month and 50% in a year. Finviz makes it easy to do --- For free:
Now, look at the stocks that meet these criteria on multiple time frames. What do they look like on a monthly, weekly, daily, hourly? Where do they pull back. What is the RSI (or other indicators) at the time of the breakout on the m/w/d/h charts? What about the pull backs? Take notes , draw trend lines. Start thinking how and where would I get in to this stock? Also think about how you would scan for your particular entry?
I can say that I worked backwords to come up with my trading methodology. looked at those 50% gainers and tried to figure out how I could get in them, stay in them long enough, and get out safely. After looking at the thousands of these types of moves, you will start to see things that can be used to put together your trading strategy. You should have a pretty good Idea of where you want to get in those stocks. There is no right answer. There are numerous uptrend strategies that work. For example:
- Range expansion
- pull back to support or MA
- Breakouts
- Backtests of B.o.
CREATE SCANS TO FIND THE STOCKS THAT MEET YOUR CRITERA
Now that you have an idea of what you want to trade, you will then want start thinking about how you will find those stocks. If you are relying on others for your ideas you are not a trader. Let that sink in.
To become a trader you must be able to articulate your set-up criteria and know how to find it. It is easy to find a scans in various forums, but that really is not helpful until you know why you want to scan for a certain condition.
I personally found that taking the time to think about what I am scanning for and how I will do it is extremely helpful in defining the setup as you are forced to write out your rules.
For example, consider a goal of "I want to be in strong stocks that are breaking out"
How will you define a "strong" stock?
There are many ways to define a strong stock. You could consider how strong the trend is? A particular RSI level, etc... Whether it has "good" fundamentals (which would also have to be defined), is it an IBD 50 stock? The point is that there a multitude of ways to quantify strength. Just do it consistently and then you can create scans for those criteria.
What is a breakout?
A breakout should be defined by a time frame. Some traders use only closing prices some use the daily high. You would need to decide how you would define it, scan for it, and then trade it.
MANAGE THE TRADE
After you are in a trade, there are numerous considerations.
- How much risk am I taking (you should know this before you take the trade)
- Where do I get out if I'm wrong
- How do I take profits?
- Partial
- Do I take a binary risk? (i.e. a trade into earnings)
These questions and considerations need to be thought out as you are doing your research for entry strategy.
WORK TOWARDS PERFECTION
One of the things I enjoy about trading is that it is a constant work in progress. No one is perfect. Tinker, add new setups. Have fun.
Subscribe to:
Posts (Atom)