1-2-3 Go!
I've learned that buying before a 2 day rest is dangerous. It is chasing a stock that have already run. We want safer entries into extreme momentum stocks. On REPH, I executed the 1-2-3- go rule perfectly this past week as it made a 40% 2 day burst.

UPDATE:
In the previous chart, I said this was ready to go.. 3 days later it hit $9.93 for a 15% move.

This was a lesson I've learned the hard way.
CAPN. I could see the Fishhook forming but I jumped it:

Had I waited for the 1, 2, 3, go, I would have gotten the buy signal the next day and a 35% 2 day move:

If a breakout before day 3 it is not Fishhook. Buying a day 1 or day 2 is buying a continuation pop on an extended stock:
IPOS:
Aftermath:
Although the initial gap faded, the next day--the 1,2,3 go day-- pushed higher. Admittedly this would be a more difficult breakout to buy than a breakout from linear action such as reph, but it nonetheless could be bought with a stop at the gap.

I personally think that it would be easier to buy off the next breakout as FRSH now has nice tight consolidation. A range expansion breakout next over $18.30 would present an ideal entry:

Risk Management: Fishhooks on a daily timeframe are short term trades. They should last 2-4 and hold the breakout.
Hold the Breakout --- preserve capital.
A good move should hold the breakout at a minimum. I got a Fishhook signal in LBIO yesterday. I took it, buying the breakout at 13.80:
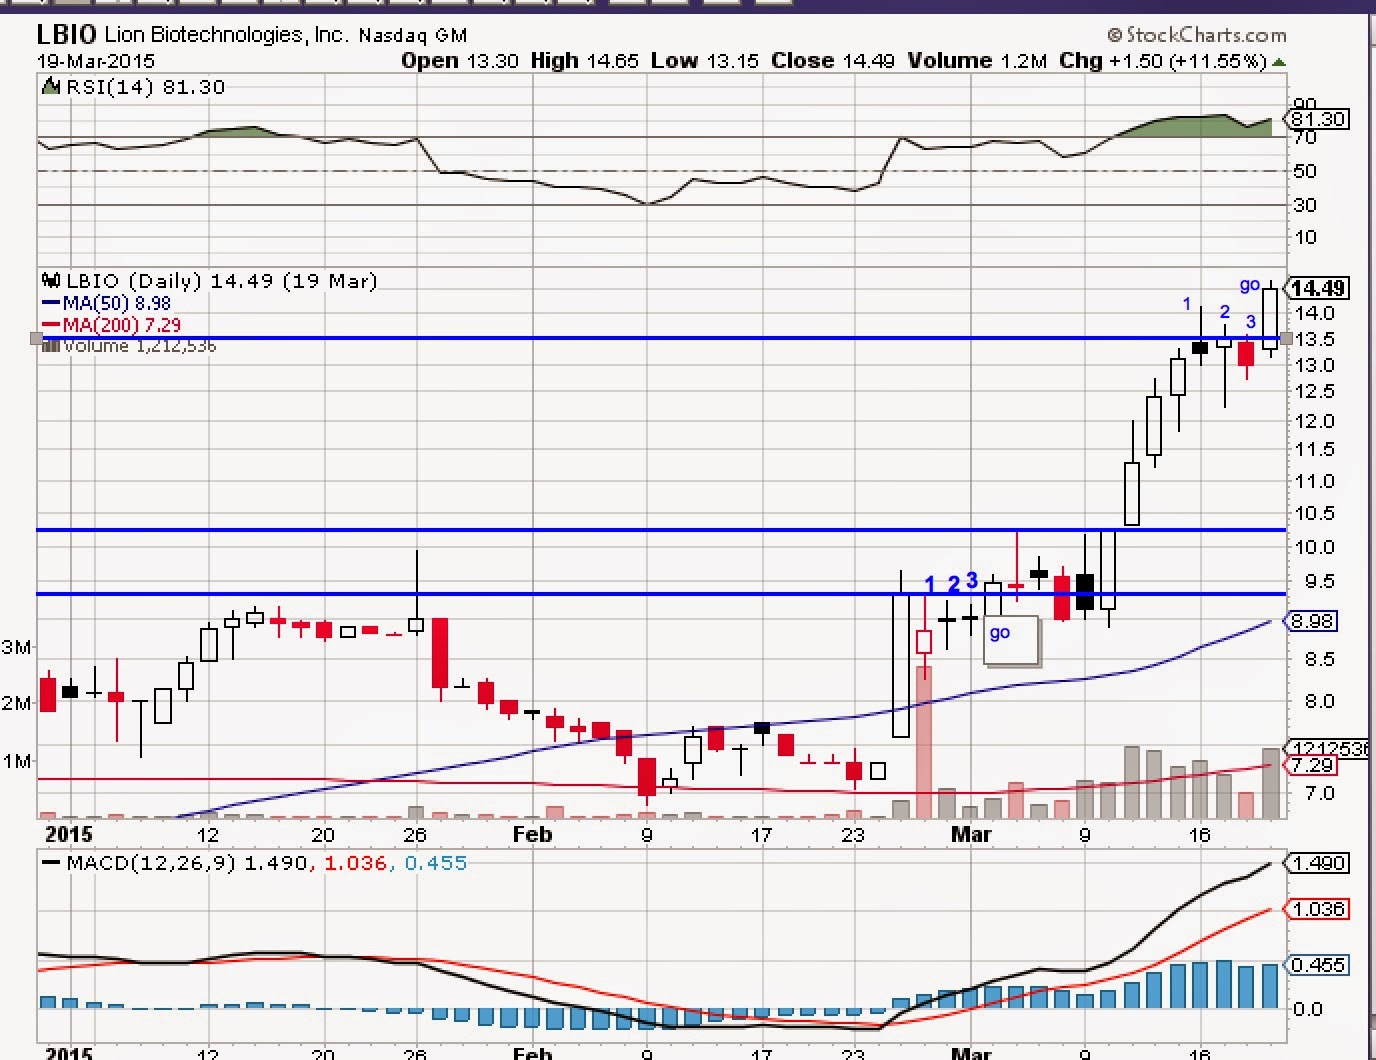
Be wary of Gaps:
Most investors talk about gap ups as if it is a positive. I hate them. As gaps often put in a ceiling. Today, LBIO Gapped to $15. That sounded alarm bells for me. Often the Gap signals a reversal in the works. If a fishhook gaps... do not let it go negative. On this one I raised my stop to $14.35. So I made $.55 on this failed fishhook. I should have raised to yesterday's close but still not a bad result for a failed breakout.

Safety Nets:
I've had a number of Fishhooks do remarkably well and others make me look foolish. I've since studied why some work and other don't. I've since determined that RSI works very well as a filter.
Here's one that failed. I bought Day 2,

Buying early was my first mistake but the second mistake was that this stock had a very poor relative strength on a weekly:


TIME FRAME
Its important to know what time frame the breakout is occurring. On REPH the daily is setup for a fishhook as described above, but on the weekly its extended. As a result, taking a fishhook on a daily, requires the exit to be taken on a daily frame.

A stock that is setup for a fishhook on a weekly may be held for a longer period when the breakout occurs. PFNX looks like it is setup three narrow range days. Any breakout above 15 can be bought:
PFNX.

Aftermath: Boom! run to $19.

Conclusion:
- A fishhook Must rest at least 2 days. Remember 1, 2, 3, GO!
- A good fishhook holds the breakout. Take the breakout preserve capital by moving stops to breaking point.
- continuation gaps are yellow flags. Any Gap requires moving stop to prior day close.
- Use the RSI and MACD for the time frame above what you are trading. If these are not setting new highs. DO NOT TAKE THE TRADE!