Showing posts with label TC2000. Show all posts

Friday, November 27, 2015

New Slingshot Anticipation Scan

A friend of mine has shown me the value of using Rate of Change to identify compression points in a stock.  We talked about combining a Slingshot in the current bar with a ROC of +/- 2 in the preceding bar.  He personally also conditions a ROC of >15 in the prior 21 bars but since my coding knowledge is more limited, I went after the concept it in a slightly different way by using  a weekly RSI > 51 for now.  I'll likely experiment some more, but I like what I see from this scan so far.

As I'm very encouraged by what It has produced, I've decided to share the scan.

Criteria:


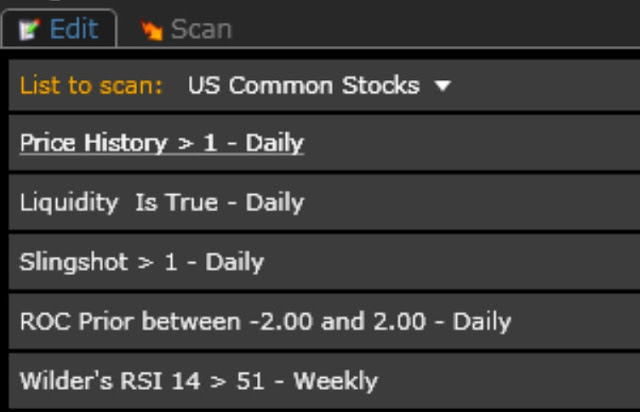
Price = personal preference
Liquidity is true = minv3.1 >=55000   -- Personal preference
Slingshot =  c > xavgh4 and c1 < xavgh4.1 and c2 < xavgh4.2 and c3 < xavgh4.3
ROC (my work around TC2k Limitations) = ((C1/c6)-1) *100
Wilder RSI > 51 weekly -- Self explanatory, but subject to experimentation. 
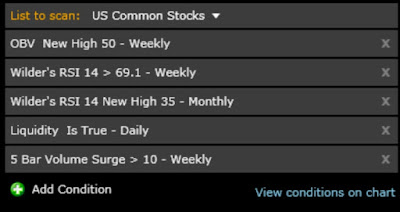
Results: 11/27/15:


Sunday, September 27, 2015

Guppy Charts

Guppy charts are an interesting way of viewing the market.  To create the charts you plot shorter Ems 3,5,8,10,12, 15 and longer EMAs in a different color 30, 35, 40, 45, 50, 60...   The profit zones live in the the "white" area of the chart where the slower EMAs have left white space over the longer periods.

It is a useful exercise to look at weekly guppies on breadth charts.  The advance / decline line is clearly becoming bearish.  Although not there yet... this is not a a place where you want to stage a fight against the market trends.


The Dow Guppy has already created bearish white space

But the nasdaq remains in the thick of the fight between bulls and bears:


Summary
Trading is treacherous here and likely to break to the down side, but bears may be early as the Nasdaq remains in the thick of the fight.

Wednesday, August 19, 2015

Creating Scans from Indicators

Let's say you want to scan for a bearish Wilder RSI of < 30.   A very common question that I've gotten is how to create a scan for an indicator in TC2000.  The good news is that is very easy and you do not have to create a PCF or know any coding to pull off this feat.

Here's a quick video of how its done:

Thursday, August 6, 2015

URSA -- The Bear Scan

After weeks of tweaking, I'm ready to unveil URSA -- the Bear Power Scan:

Universe- US Common stocks -- liquidity condition true.

RSI- Filters

  • Wilders Monthly < 49--  This was the trick-- too low and the stocks that it picked up would not be traceable.  So it's set just inside the bear territory on the monthly 
  • Weekly Weekly -- shows recent weakness
  • BOP - quarterly < 0  -- this one gets the stocks that have had a bull back breaker move-- a power full gap.
  • Price >4 too hard to short stocks below
  • Mystery short 39> 38 --- If you're a stock bee member you'll know what I'm talking bout willis.


Notes:  Unlike Mystery I do not rank.  I look for the back breaker move  and the countertrend rally draw the trend lines using the hourly or half-hourly chart for swing trading.

Great entries are a reversal move on the hourly.:

Example trade: CENX


Saturday, August 1, 2015

The Dollar Scan.

The $dollar scan is simple but effective stock that many of the top traders look for is stocks that are in play for the day.

Here's the easy you can do it in TC2000

Step 1:
Right Click on symbol in  Price chart
Create Easy Scan.
Step 2
pick up moving up net
pick $1

Step 3:
Select your stock universe and liquidity conditions.


Saturday, July 18, 2015

New Power Scan.

Here's a new scan I've been working out with a bit help from my friends.


List: 
REPH
IDI
LJPC
BSET
LPCN
ABCD
LMNS
RLH
CHE
ASC
SCMP
QTWO
CARA
SHIP
LXFT
ABIO
BIO
AMED
XNCR
GNCMA
ISLE
INSY
SRNE
RARE
BRLI
DVAX
CUBI
AMAG
TWOU
NTRI
PTLA
REMY
CMRX
CBM
DY
SUPN
DST
SKX
ANTH
NGHC
BLKB
ANAC
AVG
CSFL
AMCX
EPAM
DATA
UBSI
TLMR
SNA
IBKR
TPX
Q
ULTA
IMGN
BRKL
FOLD
PANW
PENN
PVTB
BYD
NAT
HCC
HAS
ORLY
ELNK
HALO
PLL
MSCI
HZNP
TSS
CF
FHN
EA
HCA
HIG
CCL
PGR
KHC
AIG
SBUX
DIS
FB
CUK
EROS

Saturday, May 16, 2015

Creating Momentum Watch lists

One of the things that many new traders struggle with is how to create watch lists.  Many services give stock "picks" but don't tell you how to scan for those stocks or how to create your watch list. 

My approach to trading generally focuses on trading weekly  breakouts.  The reason I like weekly breakout is because the win rates and gains tend to be higher than on shorter time frames. I'll pull back the curtain and show how I do my analysis and stock selection. 


Saturday, May 9, 2015

Finding Power Breakouts

I made this video for a trader I am mentoring.  He asked me about some specific stocks and my process for going through my scans.  


Sunday, March 15, 2015

Power Scan.

Powerful stocks have a multi-year breakout on RSI.  Here's the Scan I've been using.

This Scan provides a list of the stocks making a 2 1/2 year high on the RSI.