ADMS
RLYP
CSIQ
SWHC
CYTK
RVNC
ADMS
CSIQ
CRAY
NTGR
ACOR
SPWR
ZEN
SWHC
NTWK
VRA
CYTK
AXON
UTEK
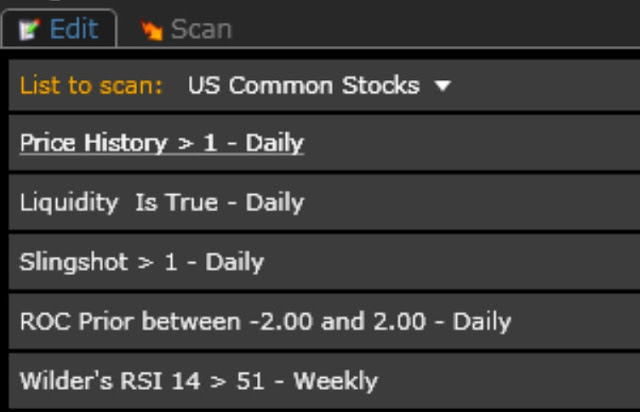
Process & Research
| Date | Notes | Momentum Driver | Grade | ||
| DT | |||||
| ADMS | 18,873,279.00 | Recent positive data on phase 3, drug | |||
| RLYP | 42,198,230.00 | Biotech, take over rumours | |||
| CSIQ | 56,281,915.00 | Solar stocks rally | |||
| SWHC | 54,804,789.00 | Guns, 25% eps sup. analyst upgrades | Demo of power, consolidation | A- | |
| CYTK | 38,699,419.00 | ||||
| RVNC | 27,951,598.00 | 19% earnings suprise | Clear DT trendline, if breaks, but has not had a multi day power rally since early last year | c | |
| MDT | |||||
| ADMS | 18,873,279.00 | Recent positive data on phase 3, drug | |||
| CSIQ | 56,281,915.00 | Solar stocks rally, 192% eps suprise | |||
| CRAY | 40,949,005.00 | Prior EPS beat and demonstration of powr | Longer base, Will need An additional momo driver and volume to be worth a trade | ||
| NTGR | 31,738,113.00 | Good EPS 26% suprise, | Base is getting long, Range bound? | B+ | |
| ACOR | 43,376,018.00 | 191% EPS, Biotech, Seizure migrane drug | |||
| SPWR | 137,267,614.00 | ||||
| ZEN | 89,099,018.00 | 16% eps suprise, (but beg. nov.) | B | ||
| SWHC | 54,804,789.00 | ||||
| NTWK | 10,360,871.00 | Small float, Recent $100 mill Contract | A | ||
| VRA | 37,932,100.00 | EPS beat, but coming from period of weak eps. | Prior anti, attempt had no follow through | B+ | |
| CYTK | 38,699,419.00 | Prior demonstration of pwr, | B | ||
| AXON | 98,741,738.00 | 20 | First pause after rally out of 2 month base, concern that it took 2 months to breakout out of last base? | B | |
| UTEK | 26,312,909.00 | -6% eps suprise | B |