I've found a lot of inspiration in Steve Stewart's Picture of Power (P.O.P.) chart lists. He has a good eye for finding the most powerful stocks this year. I've sought to reverse engineer how he does it.
I was greatly assisted by a stockBee Member who lead me to Eric Muathe. As it turns out, Muathe's ultimate breakout video series enabled me to find the Stewart type stocks.
I can't believe I had missed it all this time, but a SB member pointed me to Stewart's youtube channel. He explained his process good detail.
The initial level is pure Muathe. If you've watched Eric's videos you know what I mean. The thing however, was that I was never able to ascertain, the POP pull back method.... until now.
After watching all of the Stewart Videos I've taken some notes and here they are:
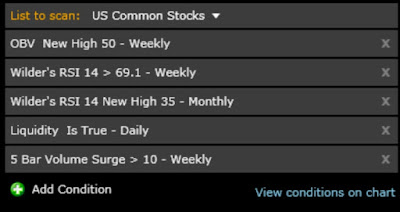
Scan process

Monthly
Power zone = monthly greater than 70. Longer the base the bigger the space. Monthlies show power --- uses Muathe Criteria
Start at historic monthly
- RSI at 3 year high
- MACD (13,34,1) new high if met got to dailies.
- Price should be near ATH. or multi-year high.
Example:

Note Monthly Does Not Provide entry signals.
Weeklies --- "Picture of Power" chart.
• 2 year weekly. -RSI Should be >69.10
• OBV high
• Performance v. SPX high.
If volume is increasing... Fantastic.
Weekly POP chart:
Setup EMA 10
RSI
OBV
RS v. SPX

Daily:
RSI above 70= bull breath halitosis
RSI is not overbought or oversold it is the muscle on the skeleton.
Massive volume spike-- bull snort.

- EMA 4 9, 20, 50
- Full Stochs and ADX (10)
Big clue is RSI > going back over 70 again after bull snort.
MAs on Daily 4, 9, 20, 50
Entry signals:
1. Week 1 pivot. Guided by EMA 4.
- week 2 follow through -- claims is signature setup.
- Focus long violent bars not short and stubby.
2. Grail Trade Setup -- based of ADX --
- ADX> 30 & pull back to 20EMA. --- *Scot1and's note an SD50 would work as well.
3. Pull back to decision line.
I don't know if this is how stewart would see it but, I guess that this would be what he is talking about when looking for the decision line pull backs.

Exit Signal:
Failure of major decision line.
Fundamentals
New product new service? Float size .. small float = knife through hot butter.
Sector
yahoo finance eps
• earning estimates increasing
• Earning surprise %
Fat Pitch: --- use during period of bearish activity.
Momo stock with a hard bout of profit taking. Looking for momo cheap. Bearish Volume comparative to bullish volume.
• Major Trendline?
◦ if none check fib levels.
• Look to hourly time frame
◦ Hourly channels -- downtrend channel Slope of hope
◦ look for divergence in the RSI and MACD divergence
◦ Stop at lower trendline or breakout on the DT Channel
- Daily RSI should be close to 30.
3-4 day rally.
Buy the DIP
Let's say we have a pull back to 10week avg. This may a good area to buy but need to zoom into hourly charts. Look for Divergence, support trendily etc:

TWO Day Rest:
I had previously worked out the Fishhook... it looks like stewart also uses it. In addition to the criteria that I've explained in my Fishhook posts, Stewart wants the rest to stay above the 9ema at the low and preferably close above the 4 ema ... on the daily.
Anyway, here is how he would draw it up:

Stewart Also uses "Cycle Momo."
The term TAILWINDS describes some condition or situation that will help move growth higher. For example, falling gas prices will help
a delivery company be more profitable. Lower gas prices is said to be a tailwind for the freight services industry. HEADWINDS are just
the opposite. Its a situation what will make growth more difficult. For example, if the price of beef goes much higher, McDonald's is facing
headwinds.
NOTE: Cycle MoMo is NOT to be used in deciding if you should or should not trade a particular stock.
The chart of the stock you are considering taking risk with (micro) should be your guide. Cycle MoMo (macro) simply tells
us if there are TAILWINDS or HEADWINDS when taking risk with a momentum stock. For me, Cycle MoMo comes at the END
of my decision process to take risk, NOT the beginning. In Map Syntax land, MICRO always takes precedence over MACRO.
But what is this proprietary indicator? What we are looking at is the RSI for the Nasdaq summation index: NASI:

NASI
NASI