What does a market that is making new highs or new lows tell us? When we get extreme values it is easy to call a bottom or a top. But what is extreme? On the weeklies, in August 11' there was a high reading of new lows, which seemed to correspond with a bottom. In Jan 12 there Was a spike to the upside, yet the market continued to drift much higher:
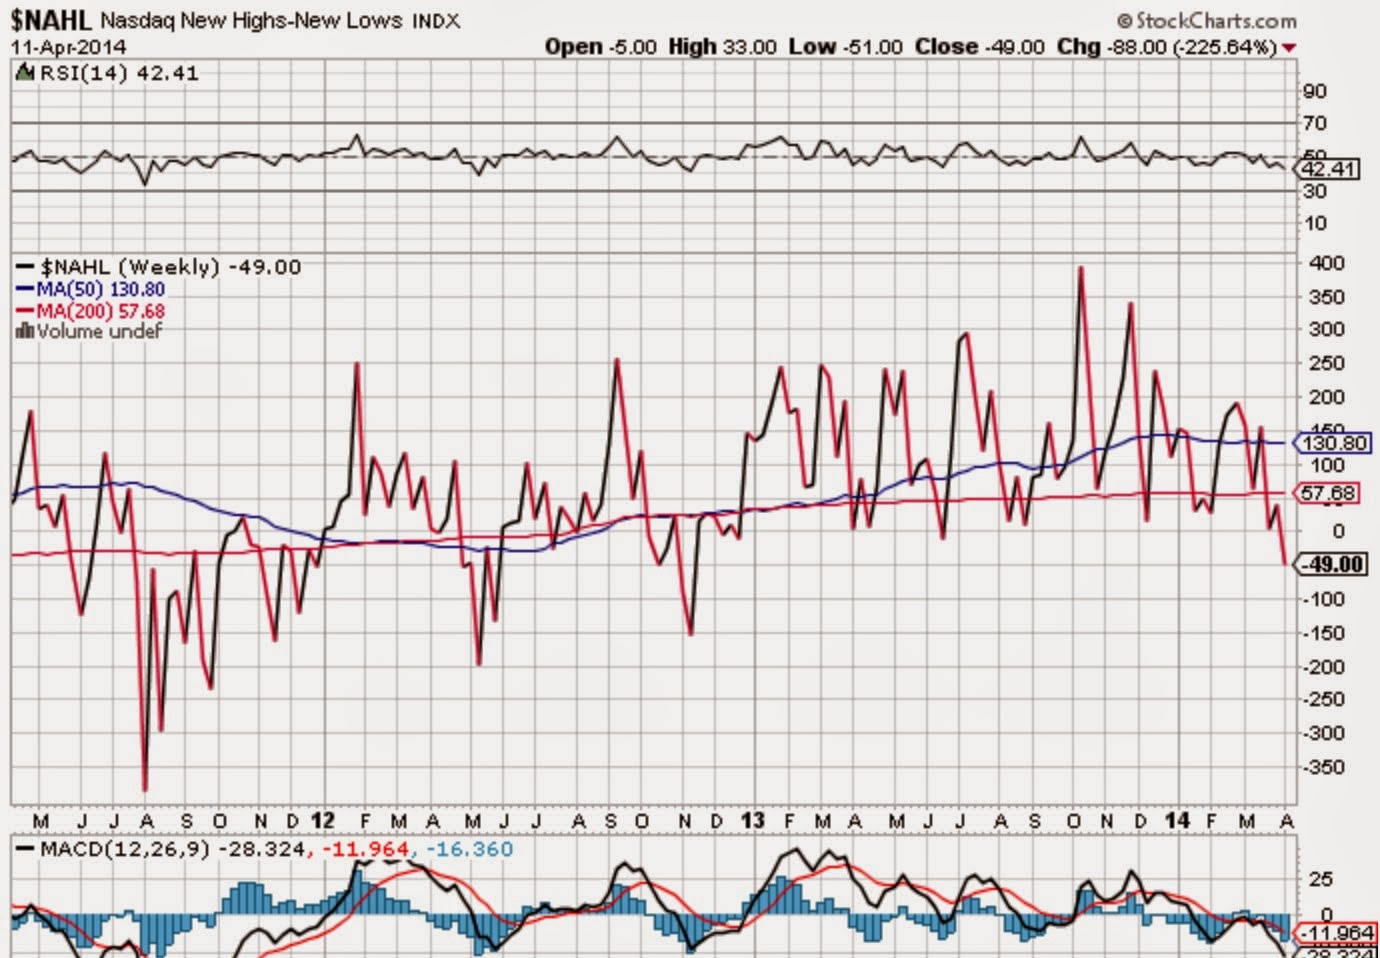

I agree that we want to trade in the general direction of this index. But if you take a position in the same direction as a "spike" you are susceptible to a harsh reversal.
I'm not sure that the indicator does that great of a job ferreting out the extremes on a weekly chart. I've personally found daily High/low Indicators better for determining divergence of rallies.
No comments:
Post a Comment