I recently received a question about my ATR Momentum Burst indicator I include on many of my charts. (3rd window).
The Bullish / Bearish Range should be well-known to many traders as it is the 4% spike. I have a volume requirement on mine, so the Bullish burst would be:
" C >= 1.04 * C1 and V >= 100000 AND V > V1"
It's my belief that momentum burst is more significant if it comes during a quiet period. To make that determination I plotted an ATR within that window:
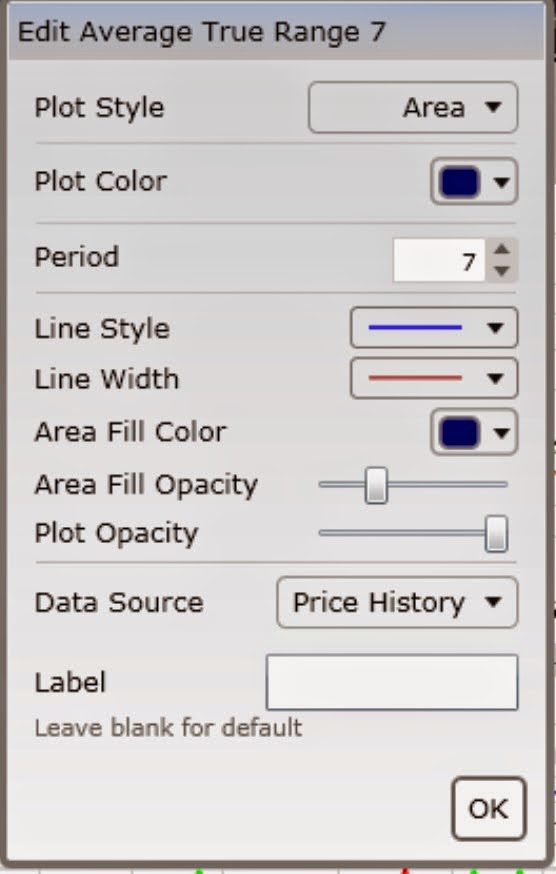
Select "Average True Range"and have it scaled by itself. Once you select the ATR it may be edited for the number of periods. I believe that the default setting is Average True Range 14. I used 7 -- which is a week and 1/2 of trading days-- but feel free to play with it depending on your needs.
I picked the area plot style with a fill, because I want to see the Momentum burst pop out of that range.
Finally, keep in mind that this is not a primary indicator. The setup trumps everything else. Second for me is volume. If those conditions are met, this indicator tells me the significance I should attach to the move.


No comments:
Post a Comment