MDT:
TI 65
TXMD (EP, Rank High)
FNGN
MXL
NKTR
INTC
AMWD
IMMU
NTGR
CYNO
NOAH
TOWR
PACB
ACRX
HII
LPTN
GSV
EPAY
NLST
IPGP
ORBC
EBS
CLX
ROCK
NCMI
SRI
SMTC
HWAY
DLTR
NETE
IMDZ
LOXO
WB
NEWM
DRNA
RXDX
TEDU
FIVN
ADRO
GDDY
LILAK
FCB
BLOX
BCOV
ANFI
TTS
FPRX
SCAI
ECOM
LMAT
EXAR
ABCO
IMOS
HA
MNST
STRL
FRED
GVA
NCTY
SA
LRCX
CASY
DPS
BRC
TAP
GTS
VSH
RTN
TER
MTD
EDU
LYTS
RGS
SECOND CUT:
TXMD,FNGN,INTC,NTGR,CYNO,NOAH,TOWR,PACB,ACRX,HII,NLST,IPGP,EBS,CLX,ROCK,SMTC,DLTR,LOXO,WB,DRNA,TEDU,GDDY,LILAK,BLOX,ANFI,FPRX,LMAT,EXAR,HA,MNST,STRL,FRED,GVA,NCTY,SA,DPS,BRC,TAP,VSH,RTN,TER,RGS
Final CUT
TXMD,INTC,NTGR,CYNO,NOAH,TOWR,PACB,ACRX,HII,NLST,IPGP,EBS,ROCK,LOXO,WB,DRNA,TEDU,GDDY,LILAK,BLOX,ANFI,FPRX,HA,MNST,STRL,FRED,GVA,NCTY,SA,BRC,TAP,RGS
TXMD ep
Minervini Trend:
TOUR -- stopped out this week, but weekly breaking out. 18 price tgt.
STMP -- Weekly chart -- Building base
CUBE
PSA
MTN
STRL
EDU ( nice daily, weekly extended)
AMWD -- Two week Flag
Friday, December 11, 2015

Sunday, December 6, 2015
Focused Swing Trade Group: Entry Assessment
On Friday GLOB was my top idea and it triggered and worked.

The assessment I need to consider is whether I was too late to enter. 35.56
I had planned to enter on a break of 35.50 based on hourly resistance points:

Although I felt pretty good about my trade plan (and this is still a profitable trade), after watching the weekend video regarding entering stocks early, I'm questioning my entry. Should I have used the 5min?
Although in hindsight I can see some range breakout of consolidation towards the end of the day on Thursday. I don't think that was a realistic entry with the markets down large, do I want to be buying into the close on a stock that was still down on the day?
On the opening surge? Many days the ranges of both the upside and down side are tested with in the first 5-15 minutes as there is a move and a counter attack. I struggle with this candle as it is so susceptible to false moves. Perhaps I'm worrying too much over .20


The assessment I need to consider is whether I was too late to enter. 35.56
I had planned to enter on a break of 35.50 based on hourly resistance points:

Although I felt pretty good about my trade plan (and this is still a profitable trade), after watching the weekend video regarding entering stocks early, I'm questioning my entry. Should I have used the 5min?
Although in hindsight I can see some range breakout of consolidation towards the end of the day on Thursday. I don't think that was a realistic entry with the markets down large, do I want to be buying into the close on a stock that was still down on the day?
On the opening surge? Many days the ranges of both the upside and down side are tested with in the first 5-15 minutes as there is a move and a counter attack. I struggle with this candle as it is so susceptible to false moves. Perhaps I'm worrying too much over .20

Friday, December 4, 2015
TI 65 Anticipation list
For the Focused Swingtrading group, here is my video diary of the process I'm using. This is for me to improve by recording the process so that I can learn from reviewing my thought process and the mistakes I make along the way.
Process video:
I re-reviewed my TI 65 analysis and made deeper cuts
ARII,AWAY,BIDU,CLLS,CRAY,CTRP,EBIX,ECOM,GIMO,HSII,IOSP,LDL,LVLT,PEGA,POWR, SMP, TRIP, TTS, XLRN
MDT/ DT
SHOR,HSII,NAII,FSB,CRAY,EBIX,XLRN,PACB,CSTM,LSCC,LYTS
Initial cut:
ACAS
AEGN
AIN
AIRM
ALNY
ARII
AVAV
AVD
AWAY
AYI
BABY
BCOV
BIDU
BRC
BREW
BSMX
BZUN
CCOI
CHFC
CLLS
COR
CPRT
CRAY
CSTE
CTRP
CYNO
DHX
DY
EBIX
ECOM
EDU
EGHT
ESL
ETM
FCB
GIMO
GNCMA
GTN
HSII
HUB.B
IMGN
IMOS
INWK
IOSP
IPGP
ITRI
IVC
JEC
JKHY
KS
LDL
LFUS
LOCK
LSCC
LTS
LVLT
LXRX
LYTS
MANT
MATW
MATX
MKTX
MN
MNRO
MPWR
NEO
NVRO
OLN
PACB
PCL
PCRX
PEGA
POWR
PSMT
QDEL
ROP
RTN
SCL
SIX
SMP
SREV
SRPT
SSTK
STKL
TBI
TCAP
TOUR
TRIP
TTS
TYPE
UFPI
UIHC
VMI
WD
WUBA
XLRN
YNDX
And the CUT:
Symbols from TC2000
ACAS
ARII
AVD
AWAY
BIDU
BRC
BREW
BZUN
CLLS
CRAY
CTRP
CYNO
EBIX
ECOM
GIMO
GNCMA
HSII
HUB.B
IMOS
IOSP
LDL
LOCK
LVLT
LYTS
PEGA
POWR
RTN
SMP
SRPT
TOUR
TRIP
TTS
UFPI
UIHC
WUBA
XLRN
MDT / DT First cut
BRSS
BECN
BZC
SHOR
HSII
ULBI
NAII
FSB
CRAY
EBIX
XLRN
PACB
CSTM
LSCC
LYTS
TGS
Thursday, December 3, 2015
Fundamental Based Scans
I'm going to be working on including some fundamental component into my trading and scanning.
The starting point has to be CANSLIM I will be using on a future project for "O'Neil" type stocks.

FOOLISH 8 M
The original Foolish 8 strategy uses eight criteria to look for profitable and rapidly growing small companies with strong price momentum. The methodology is partly built on the premise that the lack of coverage and interest in small-cap companies presents a better opportunity to locate undiscovered, attractive investment candidates.
1. Revenues: $500 million or less
2. Earnings and sales growth: 25% or greater
3. Net profit margin: 7% or greater
4. Daily dollar volume: $1 million-$25 million
5. Insider holdings: 10% or greater
6. Share price: $7 or greater
7. Relative strength: 90 or greater
8. Operating cash flow: a positive number
Here's how I created it in TC2K:

The starting point has to be CANSLIM I will be using on a future project for "O'Neil" type stocks.
FOOLISH 8 M
The original Foolish 8 strategy uses eight criteria to look for profitable and rapidly growing small companies with strong price momentum. The methodology is partly built on the premise that the lack of coverage and interest in small-cap companies presents a better opportunity to locate undiscovered, attractive investment candidates.
1. Revenues: $500 million or less
2. Earnings and sales growth: 25% or greater
3. Net profit margin: 7% or greater
4. Daily dollar volume: $1 million-$25 million
5. Insider holdings: 10% or greater
6. Share price: $7 or greater
7. Relative strength: 90 or greater
8. Operating cash flow: a positive number
Here's how I created it in TC2K:
Friday, November 27, 2015
New Slingshot Anticipation Scan
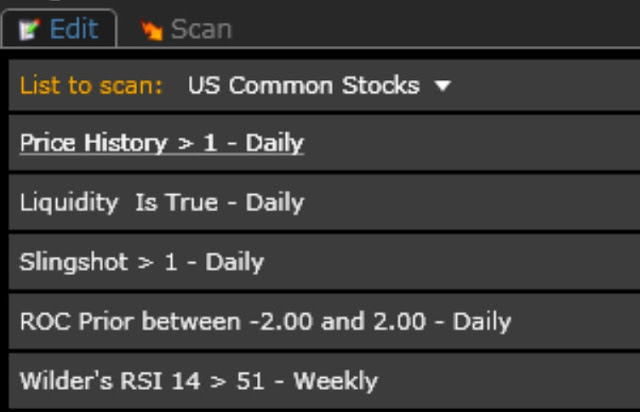
A friend of mine has shown me the value of using Rate of Change to identify compression points in a stock. We talked about combining a Slingshot in the current bar with a ROC of +/- 2 in the preceding bar. He personally also conditions a ROC of >15 in the prior 21 bars but since my coding knowledge is more limited, I went after the concept it in a slightly different way by using a weekly RSI > 51 for now. I'll likely experiment some more, but I like what I see from this scan so far.
As I'm very encouraged by what It has produced, I've decided to share the scan.
Criteria:


As I'm very encouraged by what It has produced, I've decided to share the scan.
Criteria:
Price = personal preference
Liquidity is true = minv3.1 >=55000 -- Personal preference
Slingshot = c > xavgh4 and c1 < xavgh4.1 and c2 < xavgh4.2 and c3 < xavgh4.3
ROC (my work around TC2k Limitations) = ((C1/c6)-1) *100
Wilder RSI > 51 weekly -- Self explanatory, but subject to experimentation.
Results: 11/27/15:
Tuesday, November 24, 2015
Fishing Season
Tis the season when low float stocks fly. The Fishhook Setup works great for catching big moves in these types of stocks.
Here's one that triggered today:

Use the consolidation areas on an hourly for stops.

Here's one that triggered today:

Use the consolidation areas on an hourly for stops.

Sunday, November 8, 2015
Slingshot Setup Described
Here's the main setup I've been using lately. It is a range breakout following a pullback in power stocks.
Subscribe to:
Posts (Atom)