Last week I plotted the adv/decline line as it gave a good "risk on" signal.
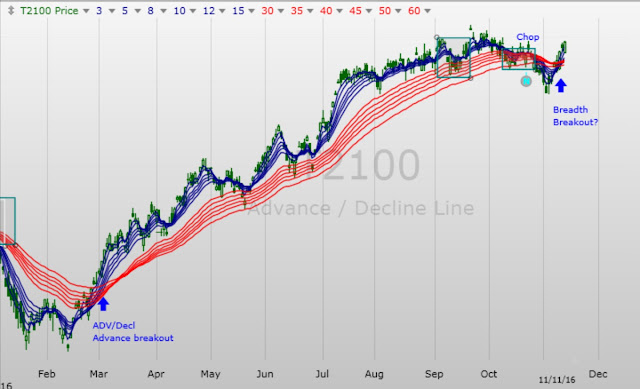
Speaking of breadth indicators, I just plotted my equity curve against an adv/decline guppy chart. It turns out that I do much better when I go with the flow.
Mar 2016 35.16%
Apr 2016 2.62%
May 2016 -3.00% --- BREADTH DECREASES (Why Am I still in? I was chopped this entire month and not positive at any time)
Jun 2016 8.28%
Jul 2016 5.96%
Aug 2016 18.83%
Sep 2016 2.68% --- Into chop Zone == Get out of market
November 9, 2016 (re-cross of Fast guppy on ADV/DECL) To present 25.01%
Win the easy ones..
No comments:
Post a Comment